
For every sales leader, the main challenge is to measure the progress of their campaigns effectively.
While metrics such as revenue and profit generated can give an idea of how successful your sales strategies have been, they do not describe factors affecting your team’s performance, current and future market trends, and the efficacy of your sales strategies.
This is why you need a proper sales analysis report that helps you analyze specific metrics or components to measure overall sales performance.
A sales analysis report provides detailed insights into the strengths and weaknesses of your company’s sales campaigns, the performance of individual sales reps, sales management, current and expected sales trends, customer data, and so on.
There are different types of sales analysis reports, including sales cycle length reports, conversion rates reports, lead response time reports, sales call reports, and many more. We’ll cover them all in this article.
But first, let us take a look at how to create a sales analysis report.
Table of Contents
How to Write a Sales Report?
Creating a report on a daily, weekly, and monthly sales basis can help increase your sales team’s performance. It enables you to analyze comprehensive sales activities taking place within your company.
It allows you to determine any bottleneck in your process and rectify it before it creates any real issue. Besides, it gives insight into the different sales funnel steps.
You can also track the performance of all the sales executives on the team.
Thanks to sales data analysis software, creating sales reports has never been this easy. It helps create interactive reports that are easy to understand and doesn’t require any technical skills to generate them.
While there are no strict rules about creating a sales report, it depends on the internal workflows of the specific company. That being said, let’s look at the traditional method of creating a sales report.
#1. Determine Your Target Audience
Before creating a sales report, the first and foremost step is to decide who your target audience is.
Here, the target audience implies the people you would be presenting the sales report to.
If you are writing a sales analytics report for your executives, they would prefer a summarized version.
On the other hand, the head of sales would prefer a document that includes a lot of key performance indicators (KPIs) and data on current and future sales performance.
#2. Decide How Your Sales Report Will Look
A sales report is more than just a document containing numbers and charts.
It should be visually appealing and easy to understand.
Your sales data analysis report should be presented in such a way that it is not too cluttered and can be read easily.
To create such reports, you can access any sales analysis template online or use a CRM platform.
Read also: Inside vs Outside Sales – Their Pros and Cons, Structure, Tools
#3. Include the Relevant Information
Once you have determined the target audience and the outline of your sales report, it is time to add information.
Depending upon who the report will be presented to, you should only include the relevant information.
Do not add details that are not important to the stakeholders. This will only make your report look cluttered and difficult to understand.
#4. Present the Information Appropriately
After you have decided what information to include in your sales report, it is time to work on the presentation.
Ensure that your report does not include too many charts or tables, too many numbers, or text. There should be a balance so that users can grasp information quickly.
You can also add a few images to make your report eye-catching and easy to read.
#5. Compile the Data
Before you start preparing your sales report, you need to know what datasets you are using.
Compiling data implies logging into your CRM platform and gathering data by either downloading it or converting it into reports right from the sales dashboard.
#6. Determine the Past and Current Periods
While compiling your sales data, you should determine the time periods you want to use for presenting your report.
This could be weekly data, monthly, quarterly, semi-annually, or yearly. Ideally, creating a sales report should be a regular event and not a one-time thing when you have to present your reports to the stakeholders.
For the chosen time period, always compare the data to an equivalent prior period.
This will give you a better understanding of whether your sales performance is improving or not.
#7. Verify Your Data
After you have collected the required data, don’t forget to double-check it.
Make sure that the data has been taken from a reliable source and is verifiable. Moreover, make sure that the information on your report is not too much or too little. The report should be balanced and include all the important details.
#8. Justify Your Data
While presenting your sales report, it is not just enough to display the numbers.
You need to back up with reasons as to why your revenue has increased or declined.
As a sales manager, do not assume that your team members already know the rationale behind sales performance.
Thus, your graphs and tables should be accompanied by a written explanation of why your company reported certain figures during a particular period and what steps, if any, are being taken to improve performance.
Read also: Sales Analysis — Definition, Types and Why It’s Important for Business
10 Types of Sales Analysis Report That You Need to Know About
There are various types of sales reports that need to be created to make different decisions related to sales.
Let’s look at the key ones here.
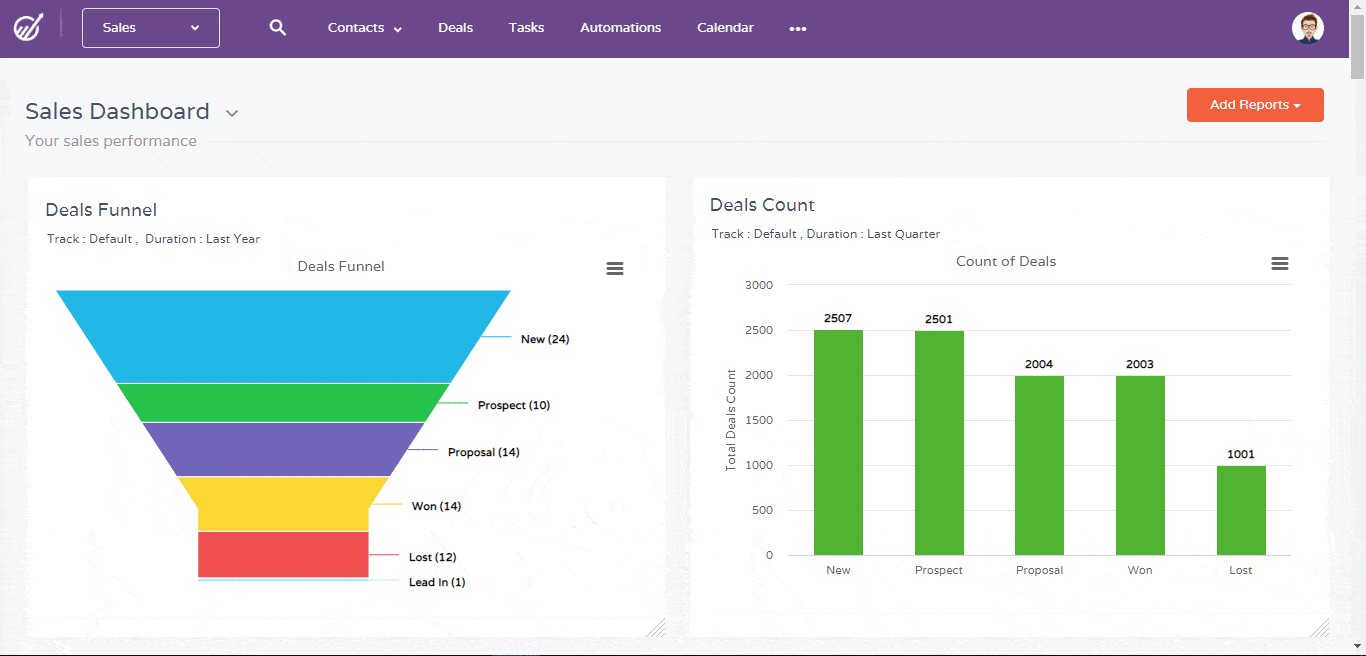
#1. Sales Pipeline Report
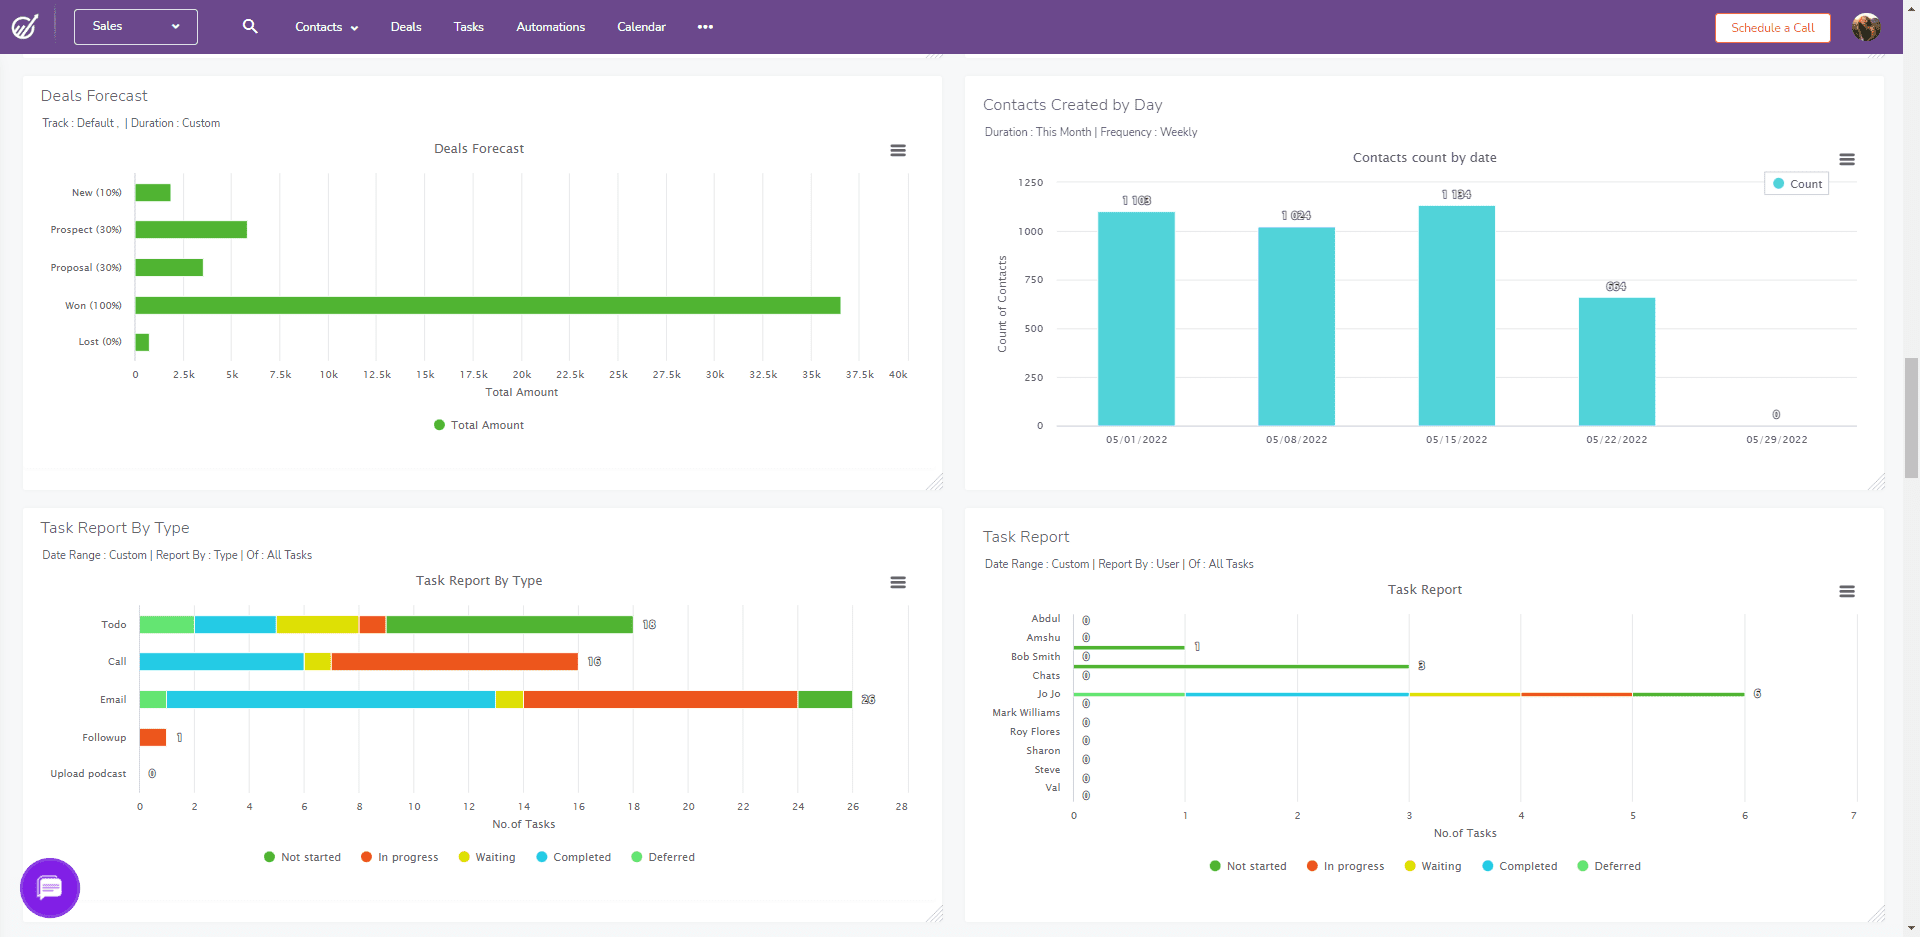
A sales pipeline report provides a visual representation of your leads as they progress through the different stages of the sales cycle.
This gives you an overview of how many leads are there in your pipeline and at which stage.
The report also gives information on which deals are most likely to convert, which you could lose altogether, and how much impact each lead has on your sales funnel.
#2. Conversion Rates Report
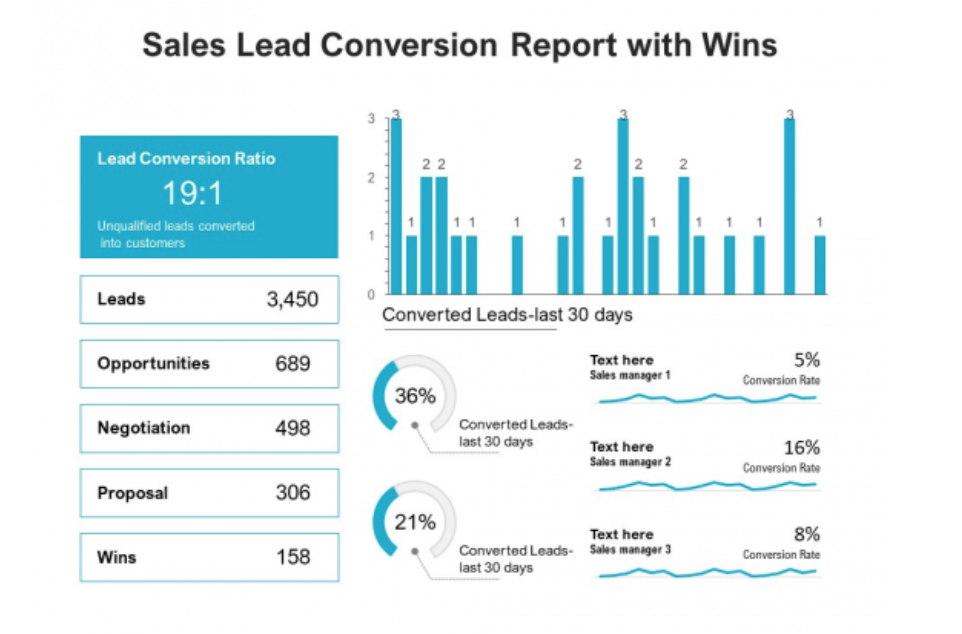
Conversion rate refers to the ability to convert prospects into leads and leads into customers.
Using a conversion rates report, you can get a picture of the number of qualified leads that were converted into customers, along with a visual representation of the conversion rate over a given time period.
Moreover, you can also see the conversion rate for each sales rep, helping you understand which team members are performing well and those that are underperforming.
#3. Average Sales Cycle Length Report
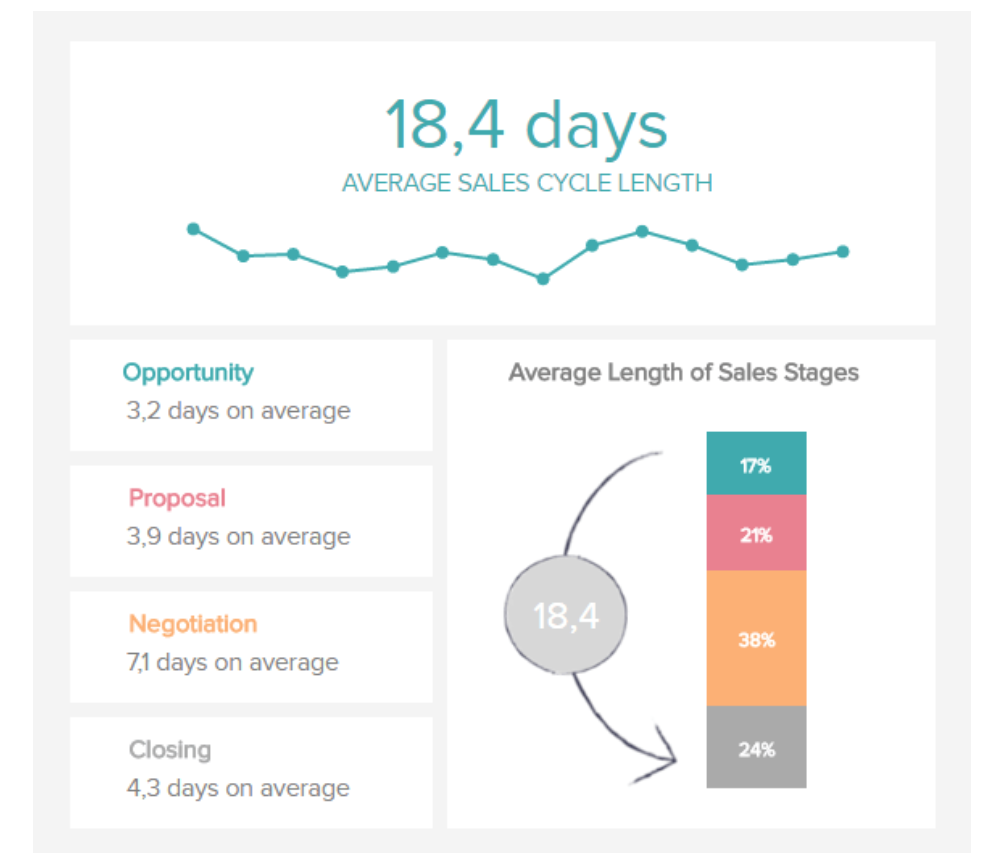
A sales cycle length report tells you the average time it takes for an individual salesperson to close a deal.
The report gives you an idea of the performance of your sales team and how efficient your sales process is.
Using an average sales cycle length report, you can get a breakdown of the length of the various stages of the sales cycle.
It also tells you how many days it takes to accomplish the steps involved, such as looking for sales opportunities, finding prospects, negotiating, and closing deals.
#4. Revenue Report
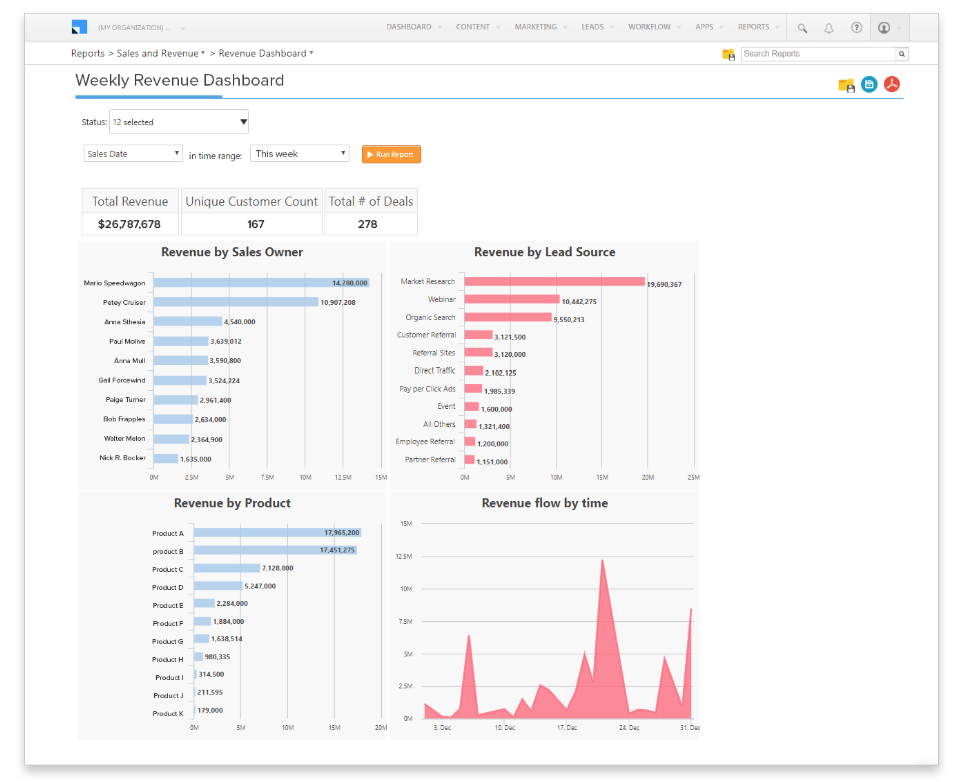
A revenue report gives you an overview of how your revenue is being generated.
If your company has more than one product or service, the report provides a breakdown of the sales generated by each product or service.
Furthermore, you can also get an idea of the revenue generated by every sales rep, the number of sales earned through different channels, and the flow of revenue over a given period of time.
Read also: What is Sales Velocity and How Do You Measure this Metric?
#5. Sales Call Reports
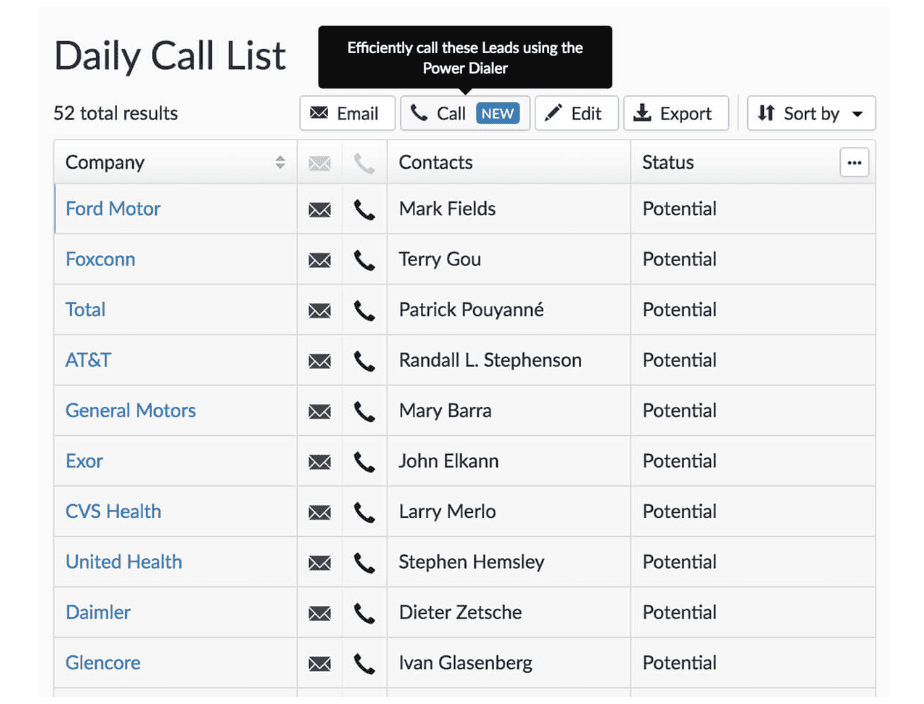
Besides the number of deals closed, another way to measure the performance of your sales team is through sales call reports.
A sales call report tells you the number of outbound calls made by the reps and how many calls helped convert prospects into leads or leads into customers.
Using a sales call report provides valuable insight into the productivity and efficiency of your sales team. It helps you understand which sales reps are converting the maximum number of leads as well as which of them are underperforming.
Read also: How Sales Call Recording Helps Build an Effective Sales Team
#6. Sales Opportunity Report

A sales opportunity report provides a detailed overview of the current opportunities for your business, the average purchase value of your product, any new sales opportunities, and lost opportunities or purchases. In other words, it helps with sales forecasting for your organization.
Using a sales opportunity report, you as a sales leader can gauge the number of opportunities your sales teams have been able to convert versus the prospects they have lost and why.
This will help you understand why certain sales reps are underperforming, and the steps that need to be undertaken to implement better sales strategies.
#7. Sales and Order Report
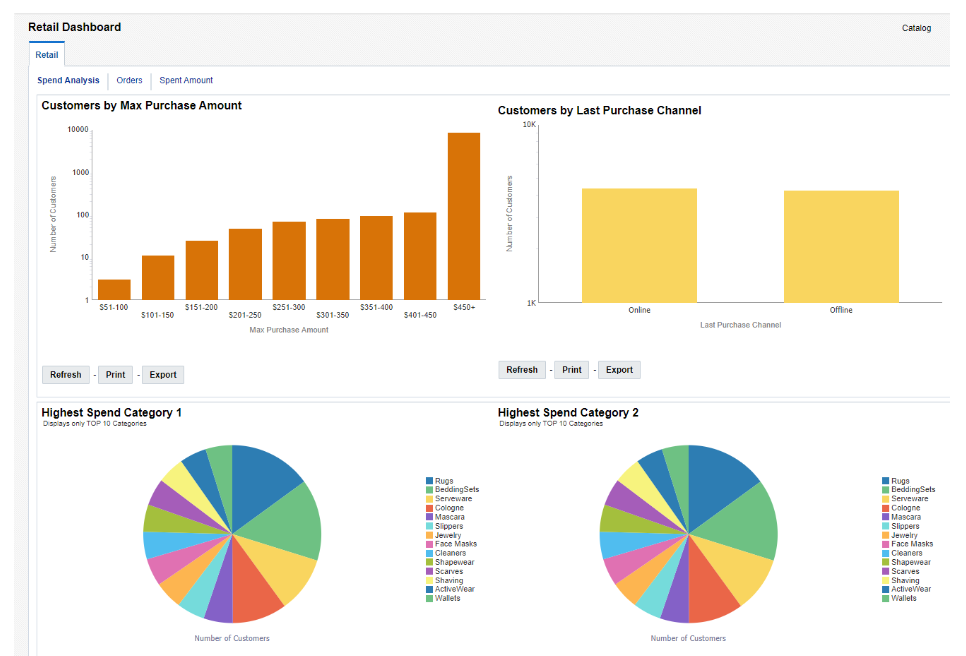
To get a breakdown of customer sales analysis, it is best to use a sales and order report.
A sales and order report gives a detailed look into how your customers spend money, which products generate the maximum revenue, and which consumers have spent the maximum amount on your products and services.
Using a sales and order report, you can compare past and current sales volume.
It can also help you understand why certain products are more popular among customers and why some clients spend more than others.
With this information, you can then design strategies to target inactive consumers and market products with lower sales better.
#8. Won and Lost Deals Analysis Report
While it is important to track deals that have not been converted yet, it is also crucial to keep a track of the deals won or lost.
A won and lost deals analysis report represent the total number and the percentage of deals won or lost by your sales team. This is particularly important to understand how many leads are there on the pipeline and how many are getting converted into paying customers.
Besides, having those won and lost deals broken down by each sales rep’s performance is an excellent way to know if they are meeting their targets or not.
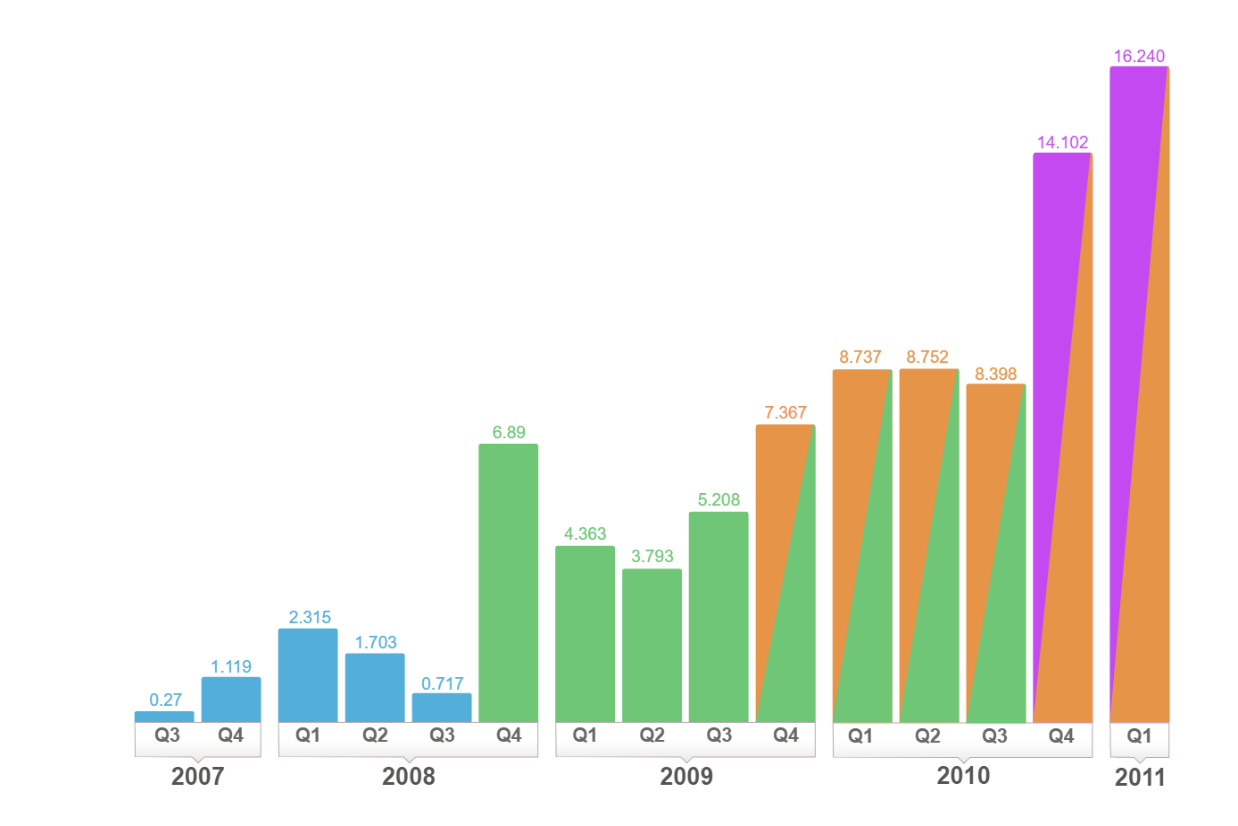
#9. Churned Customers Report
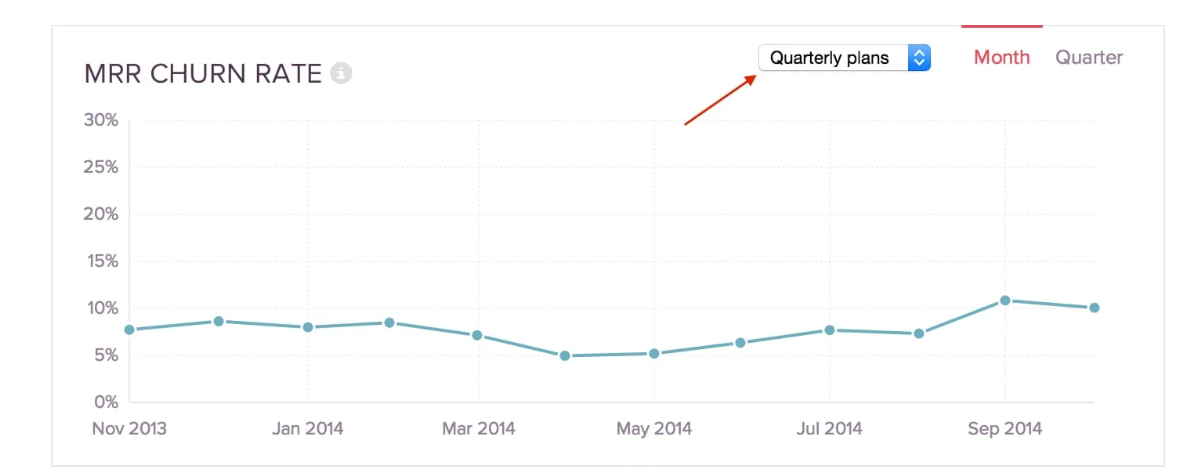
A churn rate, or customer turnover rate, is defined as the number of clients your business is losing in a given time period.
A churned customers report shows you how many consumers you have lost by comparing past and current performance.
The example shown here displays a graph with the percentage of customers that a company has lost from November 2013 to September 2014.
This gives an idea of whether your turnover rate has increased or decreased and helps discover its reasons.
Using the churned customers report, you can reframe your sales and marketing campaigns better and address any roadblocks.
#10. Marketing Collateral Usage Report
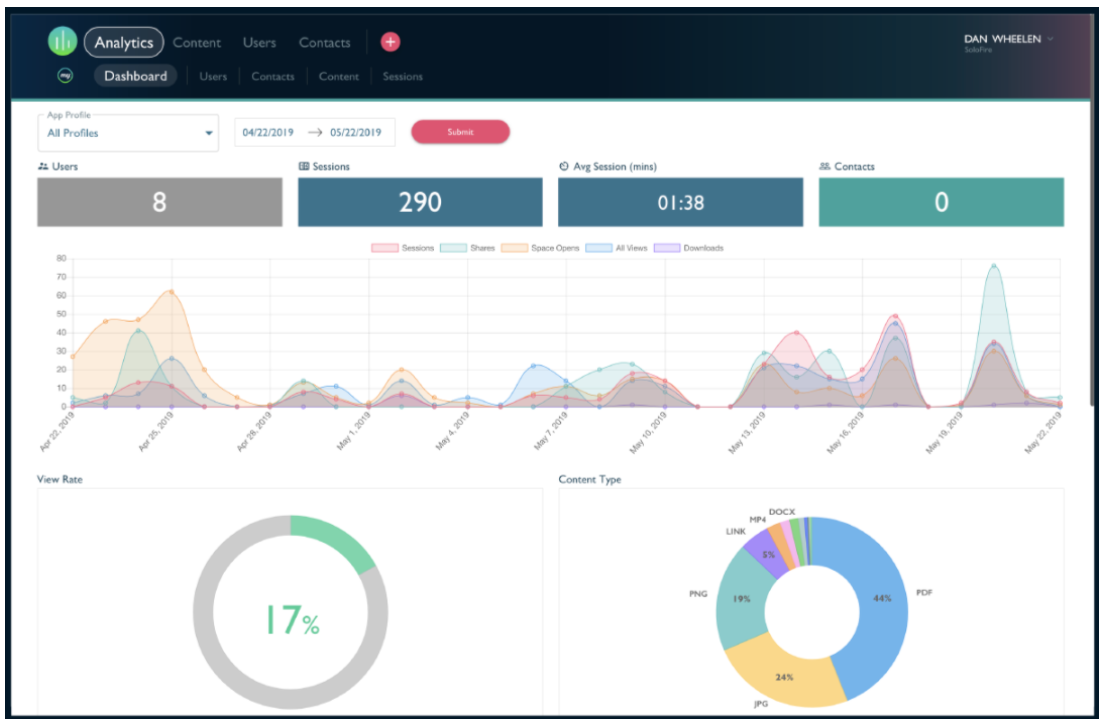
A marketing collateral usage report helps you analyze your company’s sales and marketing content.
The report gives you an idea of the content that users interact with the most and which documents have remained untouched or unused.
It also helps you understand the number of visitors or users per content or session and allows your sales team to create better and more engaging content in the future.
This, in turn, pushes for higher conversion rates.
Related blog: What is a Sales Dashboard And How to Create The Perfect One
Conclusion
Creating a sales analysis report may seem like an overwhelming task.
But once you are clear about the KPIs you want to measure and the sales goals to achieve, it becomes easy to define the type of sales analysis report you need to create and track.
It’s crucial for even a small business; it helps you understand the sales performance of your company and the metrics that can improve customer satisfaction.
These reports are of various types and allow you to address any challenges, helping increase your customer base and revenue.
If you want to know how EngageBay can help you generate detailed, customized sales reports, just sign up for free and our experts will guide you through it all.