
Data, data, and more data.
The field of sales is all about numbers, but those numbers are meaningless if you can’t present them in a way that helps you achieve your goals.
In sales, data drives most business decisions. But, data is only as good as its presentation. You can’t watch a basketball game without the scorecard. Similarly, you can’t run a successful sales operation without a sales dashboard.
Sales dashboards provide visual representations of what’s happening at any given time with key metrics like sales revenue, conversion rates, customer satisfaction ratings, and customer retention figures.
In this blog post, we’ll show you:
- What does a sales dashboard include
- Why are sales dashboards important for your business
- What are the benefits of a sales dashboard
- How to create a great sales dashboard
- Common mistakes to avoid when building the perfect sales dashboard
- Sales dashboard templates you can use
Table of Contents
What Is a Sales Dashboard?
A sales dashboard is a graphical summary of the performance of a sales team. It provides visual information to help managers and employees understand the health of their business.
The current economic climate requires companies to operate more efficiently than ever before. Sales dashboards help managers make decisions about their sales strategy, particularly in terms of the efficiency of their team’s performance.
A complete picture of the state of a company can be drawn by reviewing key metrics on a sales dashboard. It helps highlight problems and opportunities for improvement. This way, sales managers can set goals for themselves and their teams based on real-time data.
Sales dashboards also use scorecards: these can help compare trends and chart them against a particular goal.
Your sales team can understand if they’re falling short of their monthly target and adjust their sales strategies. Such contextual visualization helps keep enterprises on track with their sales performance.
Salespeople deal with a lot of data — the volume of leads, deals closed, payments, revenue targets, profit margins, sales targets, etc. For them to do their job effectively, they must have tools that help them manage the workload.
Most CRM software come with a built-in dashboard, which means you don’t need a separate software for using a sales dashboard, and you don’t need to build them manually either.
Why Is the Purpose of a Sales Dashboard?
Sales dashboards are crucial for any successful sales operation. They provide a visual representation of what’s happening at any given time with metrics such as revenue, conversion rates, and customer satisfaction ratings in one place.
Sales managers need dashboards and scorecards because they help them make decisions about how their sales force spends its time during daily operations: you have a limited number of hours in each day, so what should your sales team focus on?
Which leads seem promising? How effective has marketing been this month?
What’s happening with the negotiations scheduled for next week? A well-designed sales dashboard can show you all this data without overwhelming you.
Sales dashboards fall under four types:
- Informational: This is the basic dashboard template. It’s very straightforward and only gives surface-level information about a project.
- Analytical: Analytical dashboards provide context for the data. This typically includes background information, analysis, etc.
- Operational: These interactive dashboards visualize the administrative and operational processes of a business. They often provide insights and real-time information.
- Strategic: Strategic dashboards are meant to drive strategy and create sales forecasts. These sales dashboards are generally static and are updated weekly or monthly.
Read also: 8 Reasons Why a Sales Planning Tool is Needed For Your Business
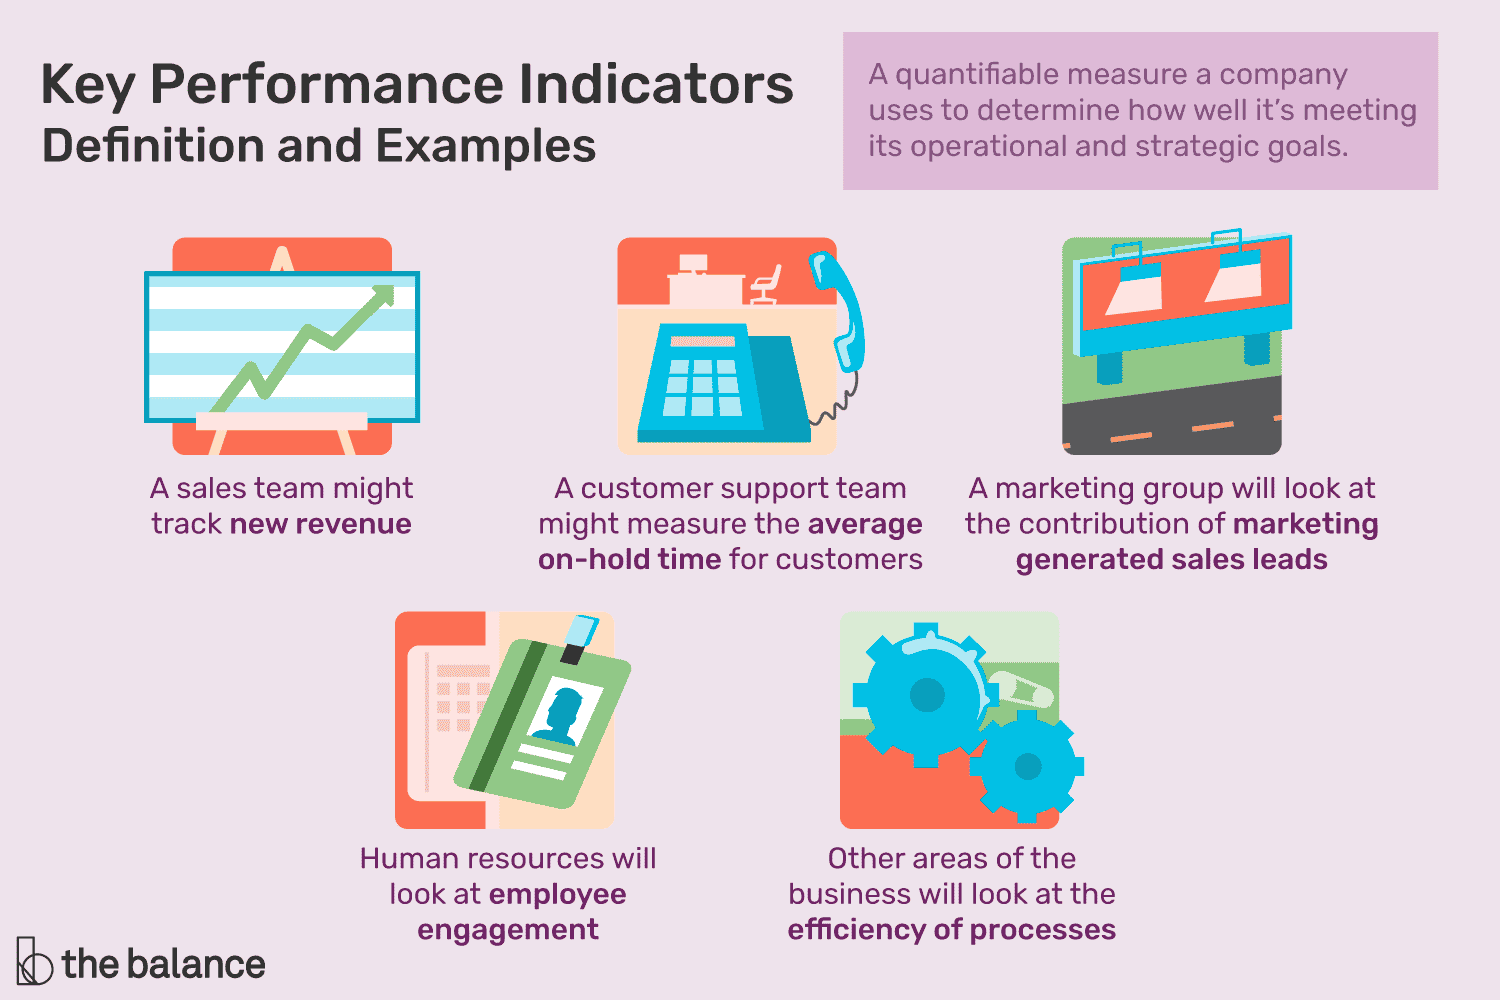
What is a KPI Dashboard?
A KPI dashboard offers a holistic view of key performance indicators through graphs, charts, and tables so that you can quickly review and analyze your sales performance. With interactive elements and actionable data, KPIs play an important role in improving your business.
A KPI dashboard can be regarded as a subset of a sales dashboard. Here, you take around 3-4 of the most important KPIs and track them over time.
Just like a generic sales dashboard, KPI dashboards have four popular categories: informational, operational, tactical, and analytical KPI dashboards.
Here are some examples of sales KPI dashboards, and what metrics each of them has:
- Sales KPI leaderboard: This can gamify the sales process — and incentivize individuals to perform better. KPIs include sales, bookings, individual sales performance against targets, team sales against annual goals, etc.
- Executive sales KPI dashboard: This KPI dashboard offers a bird’s eye view of the sales metrics and performance of the organization. Also known as the strategic KPI dashboard, it includes sales this month, sales this year, forecast this month, forecast vs. actual sales, average win ratio, and more.
- Sales activity KPI dashboard: This dashboard keeps an eye on various sales activities. KPIs include opportunities generated, activities this month, and a detailed breakdown of sales activities.
- Sales opportunities KPI dashboard: This dashboard shows the most recent opportunities and potential opportunities through KPIs like opportunity value, opportunities by unit, product, or region, and opportunities generated.
What Are the Benefits of a Sales Dashboard?
The purpose of a sales dashboard is to answer questions.
An effective dashboard not only provides sales progress insights but also drives business strategy and revenue growth.
There are several benefits to having an effective sales dashboard, such as:
- Monitoring sales performance trends over time: Tracking progress is key — and so too is recognizing when improvement has stalled. A well-designed dashboard will show the status of each element on it and identify any changes that need to be made for your sales team’s success rate to go up.
- Centralizing data from multiple sources into one place with ease: Sometimes it is hard to get reports from different departments in the same place. Sales dashboards help with that. This, in turn, enhances sales productivity and smoothens sales processes.
- Getting real-time updates: The most effective sales dashboards will always provide you with real-time updates. That means you’ll be able to see the newest data as soon as it is available.
- Increasing accountability and transparency: A dashboard centralizes all data. This way, all relevant parties have access to updated information at the same time.
As you can see, a sales dashboard can be of tremendous help in streamlining sales operations. Every employee who uses sales data to track business performance should use a sales dashboard.
This includes sales executives, sales supervisors, sales directors, marketing managers, accountants, finance managers, customer service managers, and others.
Read also: 5 Sales Planning Tools For Small Businesses to Grow Revenue Fast
What Should Your Sales Dashboard Include?
Overcrowding your sales dashboard with too many metrics is a bad idea. Instead, you need to track these sales metrics to get the most out of your sales dashboard:
- Leads by source: With this metric, you’ll gain an understanding of where your leads are coming from.
- Win/Loss rate: This metric shows the percentage of proposed opportunities that you have won.
- Upsell ratio: Since selling to existing customers is more profitable and easier, upsell ratio is an important metric to keep track of.
- Open opportunities: This metric shows how many opportunities are still on the table — and can be used to grow your sales pipeline.
- Open cases: This metric shows how many customer contact cases are open.
- Closed opportunities: With this, you can see how much sales you have generated, and by extension, the revenue incurred.
Read also: Cycle Time vs Lead Time: Definitions, Differences, and FAQs
How to Create the Ultimate Sales Dashboard
When you’re designing your dashboard, it helps to identify which key metrics you want and how you want to present them.
Here’s a short guide on how to build a powerful and sales-boosting dashboard.
Understand the purpose of the dashboard
A dashboard should inform you about everything you need to know from your sales funnel. It should help you prioritize your sales tasks based on intelligent analysis and predictions.
The sales dashboard should also be updated in real-time and available to all key sales team members so that coordination is streamlined and no time is wasted.
Identify your audience
Who will view this dashboard? Is it a high-level executive, an accountant, or a field sales agent?
Once you understand your target audience, it becomes easy to create a dashboard.
Identify the data your want to share
What information do your users need? Do they need up-to-date sales numbers or monthly totals for a specific product line?
How often does this data need to be updated?
Read also: The Sales Automation Process – All You Need to Know in 2021
Identify the sales KPI metrics
What data do you want to be able to measure? What are the goals of this dashboard, and what will success look like for it?
It can be tempting to add all data sources, but a good rule of thumb is to focus on 3-4 KPI metrics. That way, you can avoid confusion and low success rates.
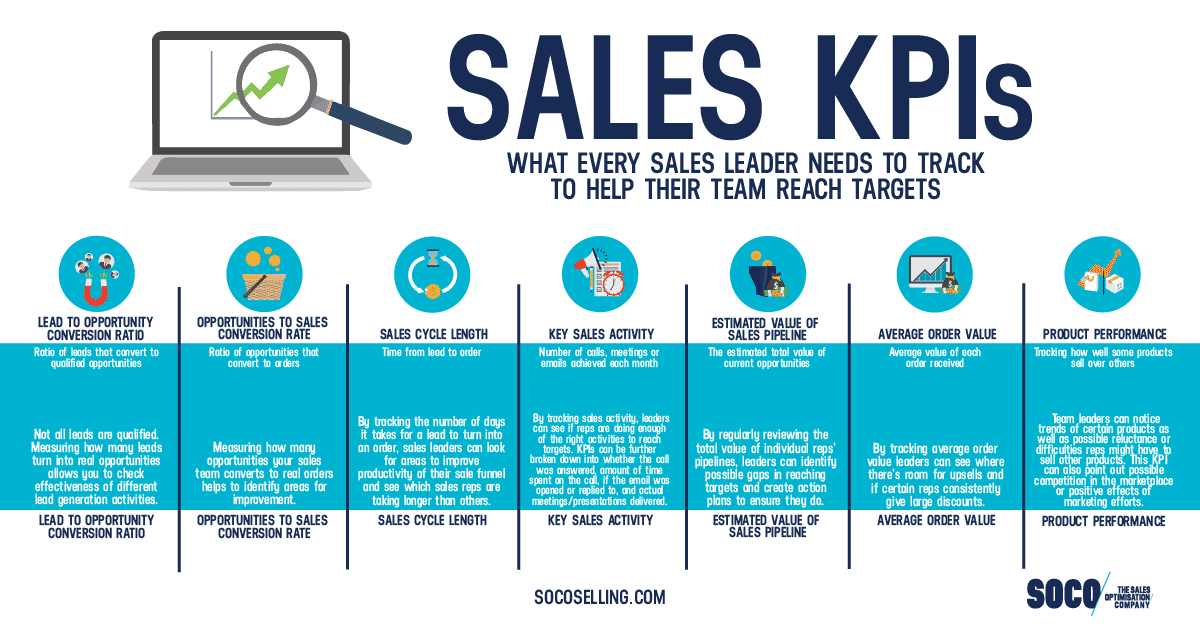
A few examples of metrics you can track are:
- Number of deals
- Leads in the pipeline
- Deals closed/lost
- Profit/loss
- Monthly revenue
- Customer acquisition cost
Select the right dashboard software
You’ll want something that will suit your requirements and accommodate the data you want to display. For SMBs, startups, and solopreneurs, EngageBay’s sales dashboard is a great option.
You can customize the templates and make them easily accessible to everyone (or some people in particular) on your sales team. Data sources and designs can be built as per your sales team’s needs.
It’s important to have a good grasp of who your target audience will be when designing sales dashboards. A dashboard design should accommodate each sales agent’s unique role and how they will use the tool.
The design and flow of the dashboard are important to consider. The dashboard should be well-organized and have clear call-to-action buttons.
By graphically charting information, you make it easier to grasp the meaning and draw actionable insights.
Be adaptable
With all these pointers, it’s easy to get overwhelmed. However, the goal is to build a tool that helps a sales rep be as data-driven as possible.
Your dashboard should be adaptable and flexible: data and goals change all the time, and your dashboard should be able to, too.
Common Mistakes to Avoid When Building a Sales Dashboard
Building a dashboard that suits your needs and presents data effectively is tricky. There can be many roadblocks when it comes to creating an effective sales dashboard.
Avoid these common mistakes.
A one-size-fits-all dashboard
Including too much information can make the dashboard complex.
Dashboards are built for varying purposes, so it’s best to select the features for your specific needs and exclude any extraneous data.
Using the wrong charts
All data is not equal. Try to choose the appropriate chart for the data you’re trying to present.
For example, don’t use a pie chart when you’re showing revenue values for the last 12 months.
Poor layout choices
If you’ve got multiple groups of information, consider turning them into separate dashboards instead. Keep all textual content concise yet informative; no one likes reading walls of text.
A good rule of thumb when designing your own sales dashboard: the simpler it is, the better.
Read also: 16 Key Sales KPIs for Small Businesses: How to Grow Revenue
Examples of Sales Dashboard Templates
Now, let’s take a look at some sales dashboard templates that you can use.
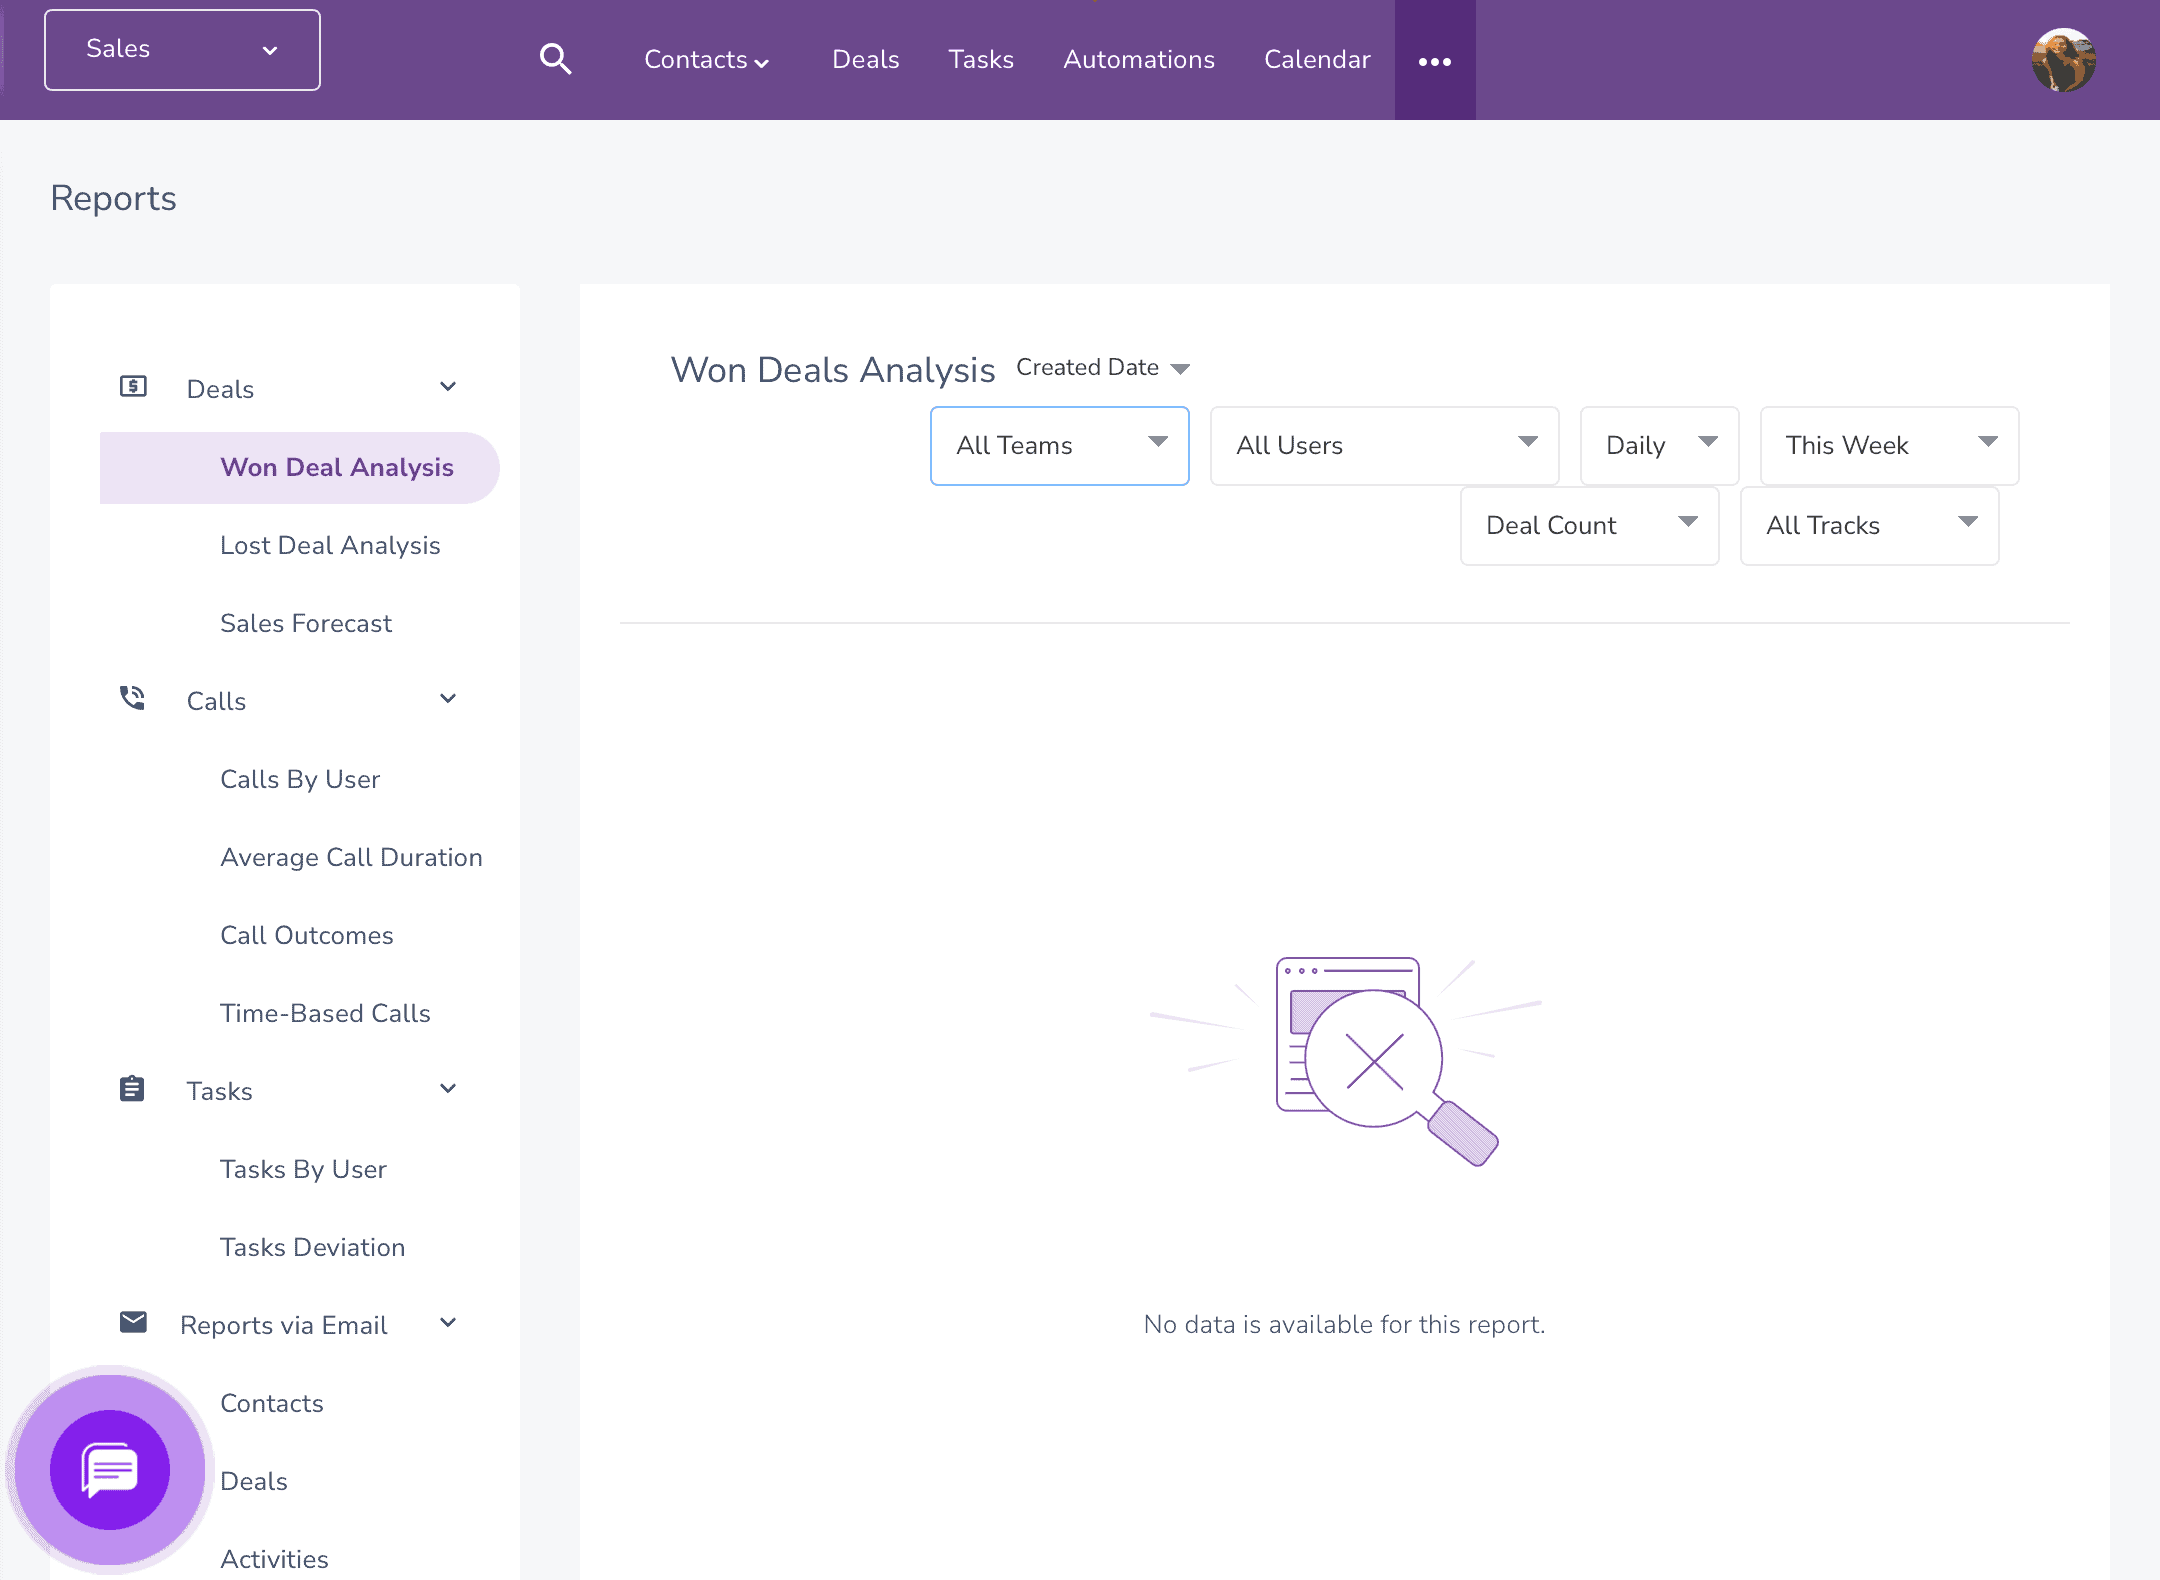
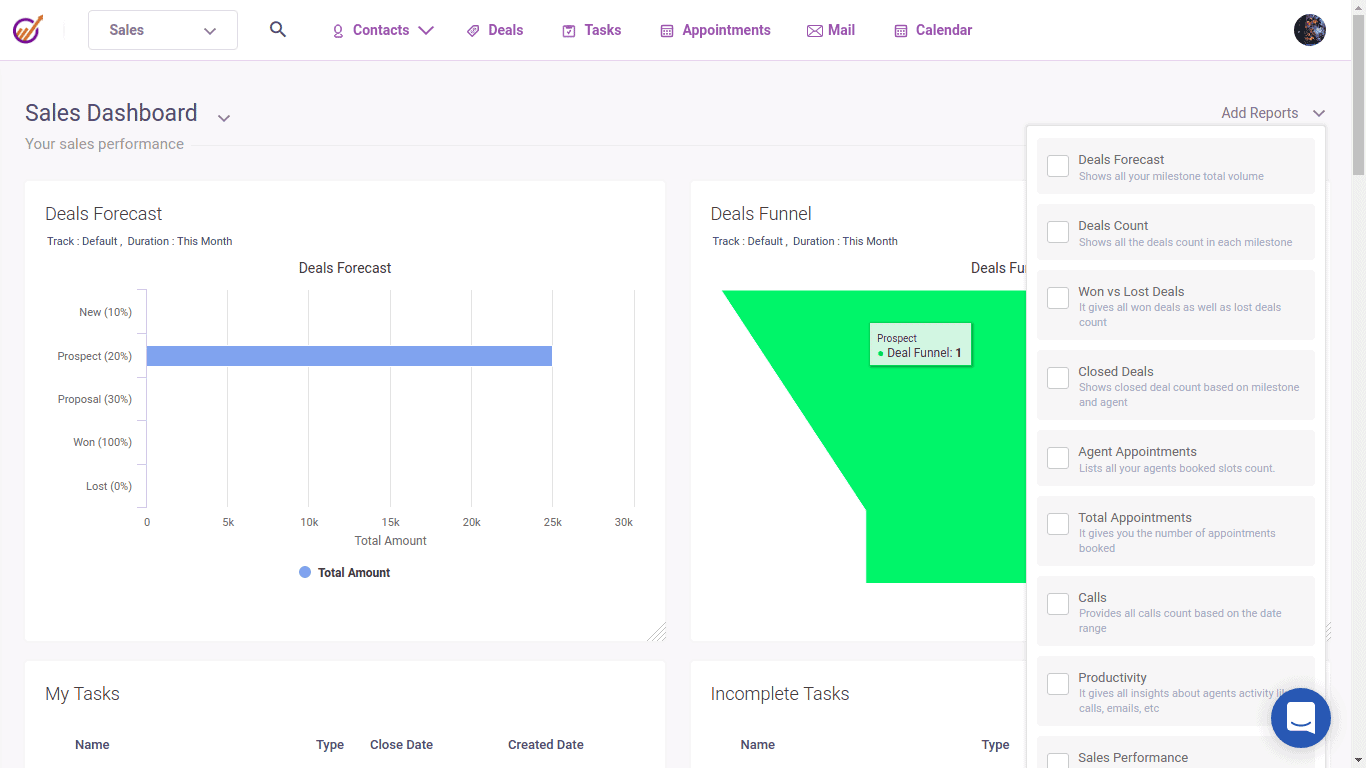
Sales Forecast Dashboard
A sales forecast dashboard is a great way to calculate the predicted sales for any particular period. An effective sales forecast template will help you identify potential sales growth opportunities by offering accurate sales forecasts.
EngageBay’s sales forecast template can help your organization identify potential sales growth opportunities and the steps necessary to capitalize on those opportunities.
This template is helpful for sales analysts and representatives.
Read also: Sales Forecasting — Comprehensive Guide For Small Business Owners
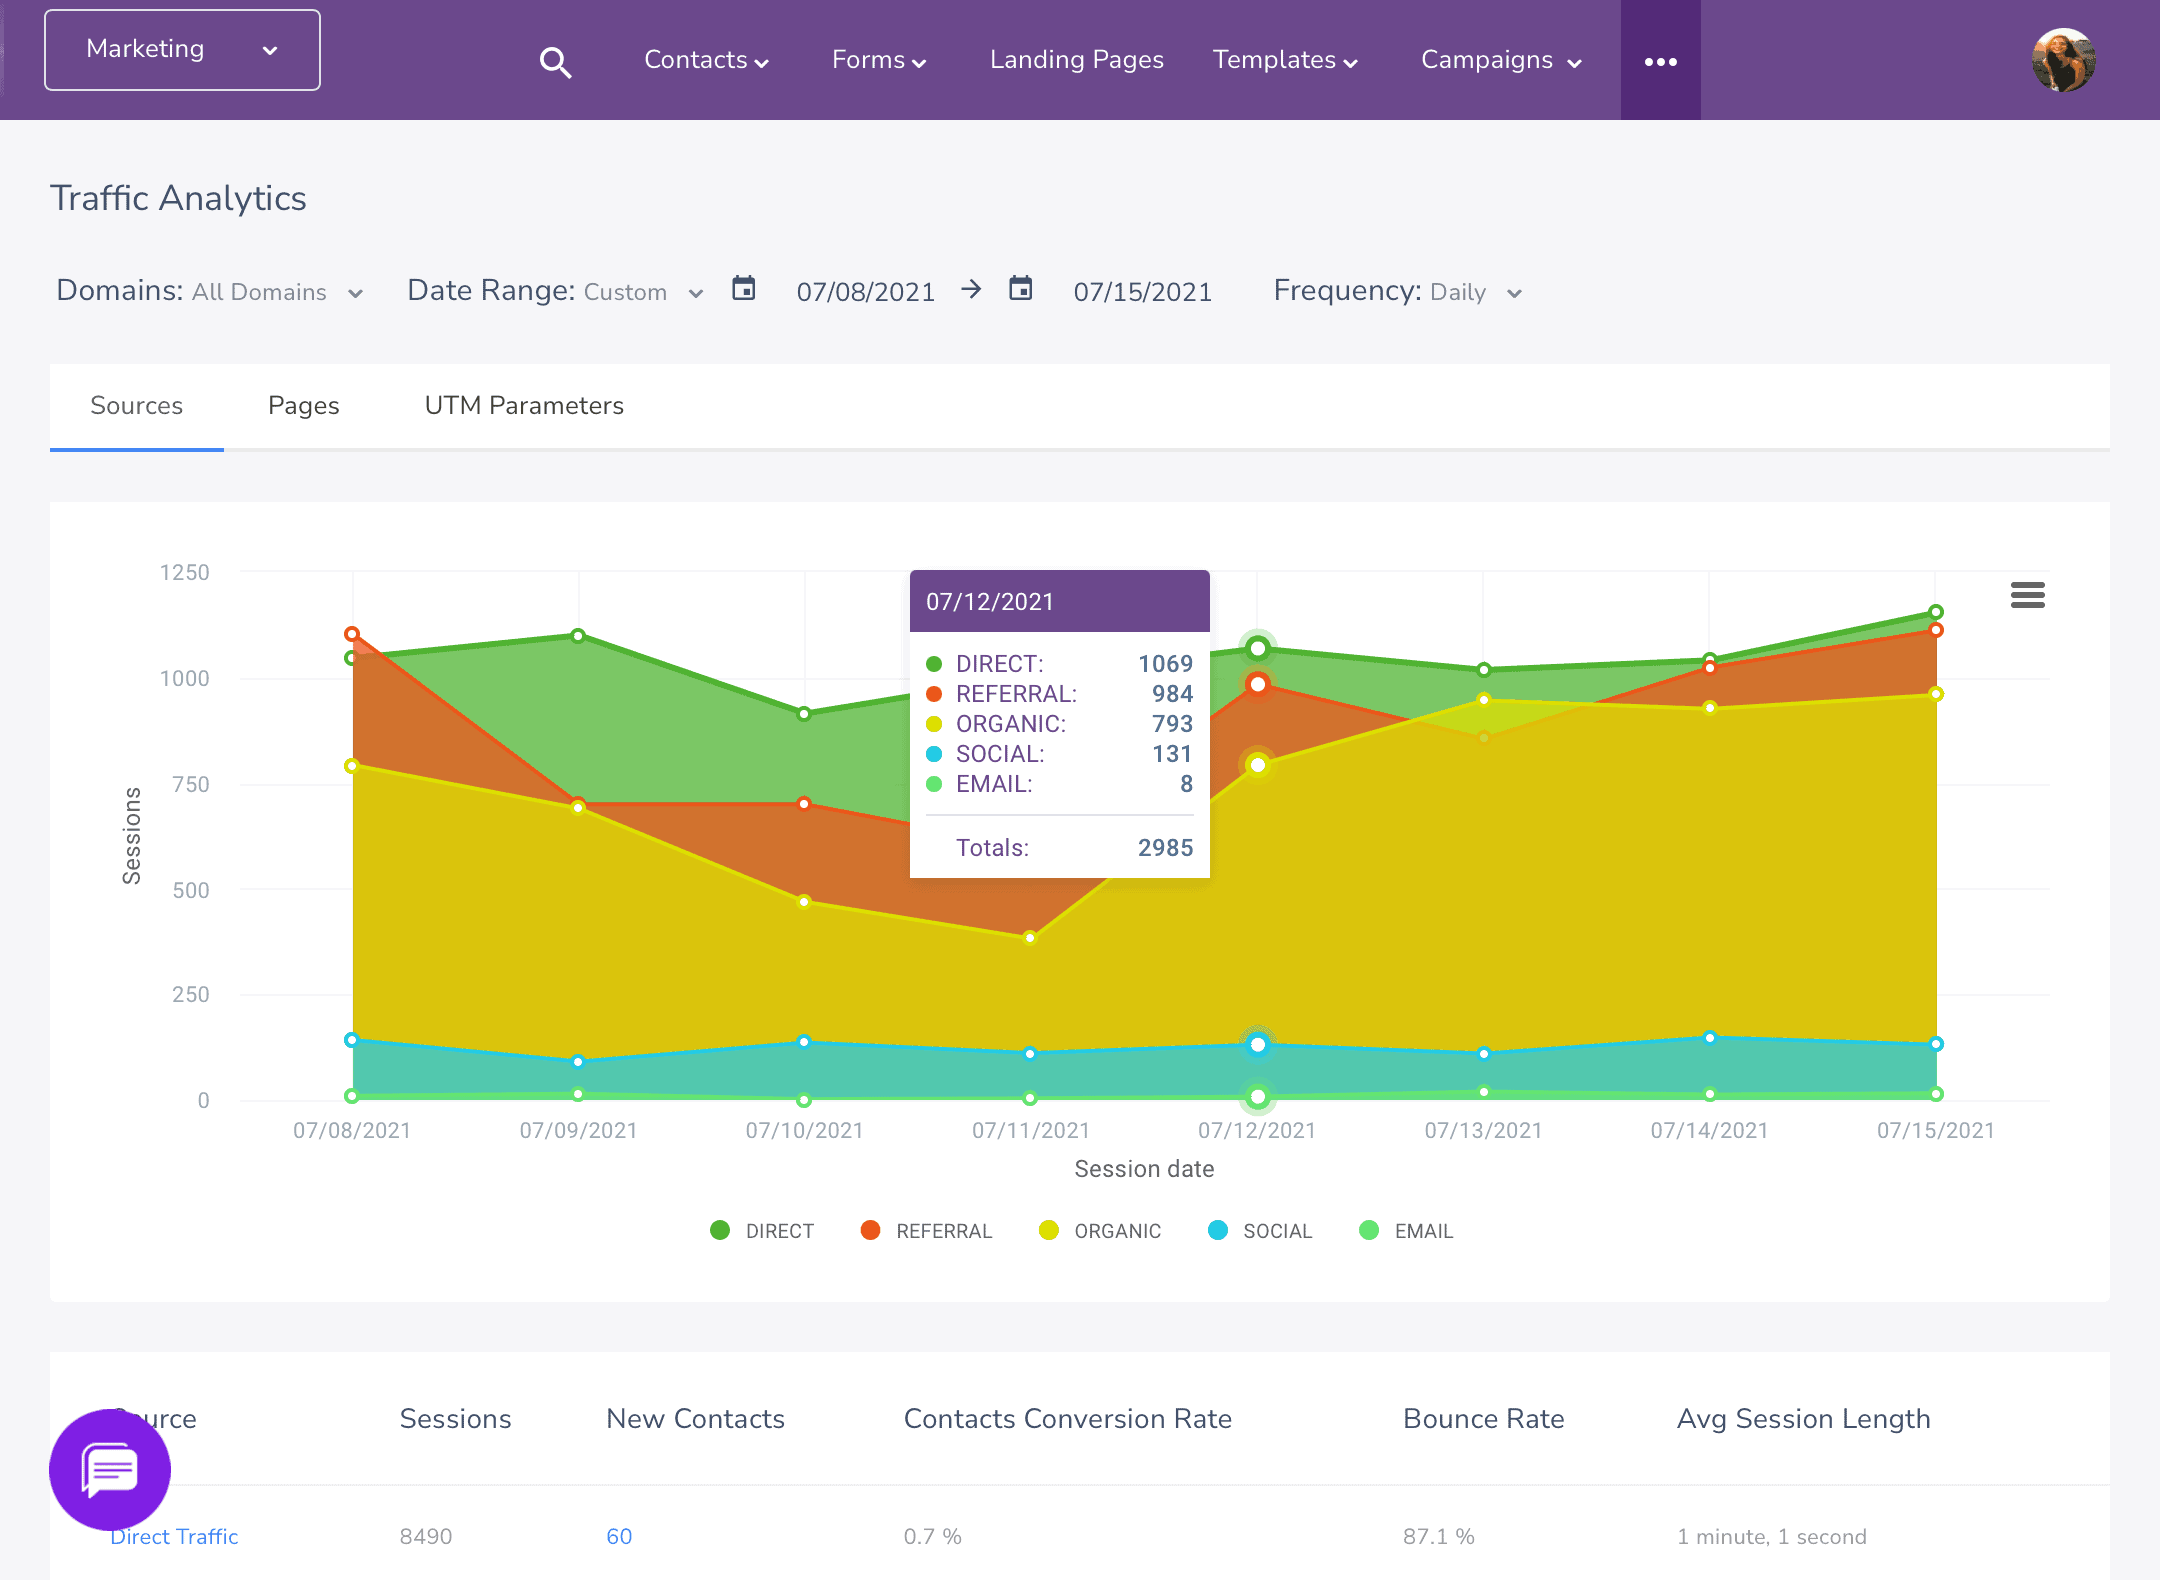
Sales Automation Dashboard
A sales automation dashboard gives sales managers and professionals visual and interactive workflows and reports to help make data-driven decisions.
This dashboard template can provide you with the visibility that analytics alone cannot. EngageBay’s sales automation will allow you to track everything from your sales performance to where prospects are coming in and how they’re converting.
Sales automation templates offer an affordable way to get organized while cutting down on unnecessary administrative tasks and saving valuable time!
Sales Pipeline Dashboard
A sales pipeline dashboard can help you understand the status of your sales pipeline.
Use a template to identify trends in how prospects convert from one stage to another as they move through your sales funnel. You can also track opportunities and monitor what deals you should prioritize.
Sales Management Dashboard
A sales management dashboard can help a sales team close more leads. It offers an overview of all contacts, emails sent, and scheduled appointments.
This dashboard template is helpful for sales managers and analysts — which essentially makes it a sales performance dashboard.
Here’s a video showing EngageBay’s sales platform, including the intuitive sales dashboard:
https://youtu.be/PhbsYEmb3T4
A sales growth dashboard helps a sales manager effectively identify trends, nurture leads, and drive growth. EngageBay’s sales growth dashboard can empower sales leaders to make more strategic decisions with data-driven insights.
Use this template to create a customized dashboard that captures metrics and delivers a detailed analysis of your sales funnel.
Read also: Sales Force Automation (SFA) — An Easy Guide to Help You Get Started
Sales Activities Dashboard
A sales activities dashboard tracks the activities of each sales representative. EngageBay’s sales activities dashboard is designed for high-volume sales teams that need more insight into how sales reps are performing against targets.
It allows a sales manager to quickly drill down and assess individual performance, identify opportunities for improvement, and provide targeted coaching.
Use this dashboard template to create a customized sales activity report that illustrates how a particular sales rep is performing against targets concerning their goals.
Read also: Sales Engagement — What, Why, and Best Practices Explained
Conclusion
Dashboards are one of the most important tools for any sales operation.
When it comes to data, the more information available about your customers, the better — not just in terms of the volume, but also by having all that information organized into something meaningful like a dashboard.
A lot of software tools offer interactive and intuitive sales dashboard options. However, most of the good options are super expensive.
This is why we’ve created EngageBay, an affordable all-in-one marketing, sales, and customer support platform with a free, integrated CRM.
You get an informative and customizable sales dashboard that shows all your important metrics the moment you log in. Plus, you don’t need to shuttle between different business management software for sales, marketing, and customer support — you get all of them in one comprehensive, customizable, and intuitive package.
Try out the sales dashboard in EngageBay today — you won’t have to pay to get started!