
When was the last time your team put together a daily sales report?
A sales report details all sorts of pertinent sales information, from the number of deals closed to how many leads entered the sales funnel and how many of those leads your sales reps converted.
Without thorough, regular reporting, determining when your team met critical benchmarks is difficult and sometimes impossible. You also can’t identify gaps, bottlenecks, and other areas that need improvement.
If your team has been lax on your sales reporting, there’s nothing you can do now to change the past. All you can do is begin improving for the future, and that begins with knowing how to produce a comprehensive sales report.
This guide will explain how to write a daily sales report and the benefits of organized sales reporting. We’ll also share real examples of daily, weekly, monthly, and quarterly sales reports, so make sure you keep reading!
Table of Contents
The 7 Types of Daily Sales Reports
Before we can get into the steps for writing your own daily sales report, we have to go over the types of reports you may produce. Here’s an overview.
Sales Call Reports
First, there’s the sales call report.
Your sales reps should always make phone calls to leads to convert them into buying customers.
When this happens, you must track the calls made to determine how many calls your reps make, how they’re qualifying leads on the call, and how many leads convert to customers based on the calls.
Sales Funnel Reports
Where do your leads currently sit in the sales funnel? With a report centered on the funnel, you can gain insights into which leads are readiest to convert based on their progress in the sales funnel.
Depending on a lead’s progress, a sales team can further nurture that lead or present a product or service just in time to inspire a purchase.
Through a sales funnel report, your company can also gauge where your sales pipeline might need improving. For example, if leads always seem to get stuck in the same place, there might be a bottleneck you need to work on.
This will allow future leads to move unimpeded through your sales funnel.
Upsell and Cross-Sell Reports
Next, you could produce an upsell and cross-sell report.
Upselling convinces a customer to supersize their purchase by buying something else, and cross-selling recommends a related product or service to a customer based on their original purchase.
You can use an upsell and cross-sell report to identify these unique sales opportunities and determine which of your products and services most successfully upsell and cross-sell.
Sales Conversion Reports
Every sales rep wants to convert leads to customers, but how often does your sales team achieve this objective? A sales conversion report will paint a clear picture.
These reports do more than tell you which subsets of your audience purchases from your company the most frequently. You can also determine which audience groups aren’t buying and then try to figure out why.
A good sales conversion report should include more than basic information on which leads converted versus which didn’t, but also go into detail on which sales methods your reps used so you can gauge which were the most successful.
Opportunity Score Reports

Also known as sales opportunity reports, an opportunity score report uses a scoring metric of your company’s choosing to quantify your leads.
In other words, you’re assigning lead scores so your sales reps can gauge which leads are the warmest (and thus likeliest) to convert. You’d use a lead’s behavior–from subscribing to your newsletter to opening emails–to assign them positive or negative points.
The leads with the highest scores are the ones most worth pursuing.
Sales KPI Reports
Key performance indicators or KPIs tell us a lot about the performance of your sales team and how well your products and services sell.
In a sales KPI report, you can gauge the above metrics and others. The more frequently you produce sales reports, such as daily or weekly, the more insights you can draw from your KPIs.
Sales Forecasts
The last type of sales report is possibly the most valuable: the sales forecast.
A sales forecast uses historical sales data to determine what your company’s sales future looks like. Although not ironclad (no prediction is), sales forecasting produces a reliable gauge your company can use to make future business decisions.
Read also: Why You Need the Sales CHAMP Framework as Lead Filter
How to Write a Sales Report – 8 Steps
Are you ready to sit down and produce a daily sales report? Here are the steps to follow.
Step 1 – Choose the type of report
First, you have to decide which kind of sales report you’ll produce. Does your team need a sales forecast right now or a sales KPI report?
You might choose to write more than one kind of report back-to-back, which is fine too!
Step 2 – Select the reporting frequency
Now it’s time to confirm how often you’ll report sales. Will you track monthly sales or begin reviewing metrics every week? Perhaps you’ll push your reports out further, such as quarterly or yearly reports.
It’s up to your company to select the most appropriate reporting frequency. However, keep in mind that no matter how often or infrequently you’ll write sales reports, you need to keep it up.
You’ll need a plan for more frequent sales reporting, with a dedicated person or small team to write the reports every week or month.
Step 3 – Choose your goal
Although the type of sales report informs your goal, it’s still good to actively pinpoint your goal. You can have multiple goals.
Do you want to convert more leads? Bring in more qualified leads? Increase your sales? All the above? Make your goals more concrete before you begin putting together your report.
Step 4 – Narrow down a timeframe
No, we don’t mean sales reporting frequency here. Instead, you want to select a timeframe for the data reporting.
How often you produce reports will influence your timeframe. For instance, if you put together reports every week on the dot, you’ll only report for the previous week’s data because everything else is accounted for.
If you only publish sales reports quarterly, you’ll have a larger timeframe of data to select from. Narrow it down to a specific period or periods of interest to prevent the report from becoming too bloated.
👉Empower your sales team with the best lead management practices – learn more in our expert guide! 💪
Step 5 – Collect the relevant sales data
Now that you know the sales period you’re searching for, you can easily comb through your company’s sales records and cull the relevant data. That’s why narrowing down the timeframe helps so much, as you can collect the data you need faster.
Step 6 – Add visual data
A daily sales report shouldn’t merely regurgitate raw data onto several pages. Instead, you want to extrapolate and decorate the data.
Visual data like charts, graphs, and tables make it easier to digest your report. Your company reps can read through the relevant data in the chart or table instead of paragraph after paragraph of raw numbers.
These visual elements also add some pizzazz to your report, which is always nice!
Step 7 – Analyze and summarize the data
As we said in the paragraphs above, you should extrapolate the raw data you collected through analysis.
What does it all mean? Is your sales team performing well? Have they converted enough customers according to sales quotas? How closely are the sales performances matching up with sales predictions?
It’s up to you to answer these questions and then present the data as a succinct summary in your daily sales report.
Step 8 – Include an action plan
Rather than just ending with data analysis, wrap up the report with an action plan.
An action plan guides your company on the next steps based on the data in the report. For instance, if sales are down, you can develop strategies for short-term and long-term sales improvements.
Even if sales are on the upswing, you’d still present actionable steps your sales reps can take to keep sales where they are or drive them up further.
Read also: 10 Sales Analysis Reports To Improve Sales Performance
The Advantages of Sales Reporting
Writing a daily sales report isn’t admittedly the most expedient process, especially if you’re producing daily reports, but it’s absolutely worthwhile. Here are some benefits of frequent reporting.
Identifies your top sales reps
When you have superstar salespeople, they will rise to the top once you begin putting together sales reports daily or frequently.
Knowing who sells the most among your reps is best, as you might assign them large and important accounts. After all, these sales reps have the greatest chance of closing the deal!
Improves accountability
As much as everyone wants to be the top seller, there’s only room for a few at the top. Sales-oriented reporting makes it impossible for sales reps to hide in the background or blend into the team.
For better or for worse, all your reps will have to become more accountable for their own performances.
Motivates sales teams
Once your daily sales reports begin separating reps by who performs best versus worst, that and the accountability aspect will push your sales team to do better.
The ones who aren’t selling will want to improve, either out of a sense of personal drive or out of fear of losing their jobs. The reps who sell well will want to sell even better once they see how well the top reps are doing.
Those top sales reps will want to continue to perform at their best to hold onto their acclaimed spots!
Betters the sales funnel
Now that you’re writing regular or daily sales reports, you understand your sales funnel more innately than ever. You can quickly identify issues with the funnel, like bottlenecks, and strive to improve them.
Each change you make to the sales funnel that allows customers to progress more easily will result in more conversions and sales for your company.
Highlights the right tactics and strategies
Speaking of conversions and sales, you can quickly find the top-selling strategies and tactics through daily sales reporting and focus on those.
If you have members of your sales team who aren’t using these selling strategies, they can change tact and improve their own successes and, thus, the company’s success as a whole.
Makes more accurate forecasts
Producing sales reports daily also enables your company to have more accurate sales projections. You can use these forecasts and current sales data to make sound financial decisions that will carry your company forward.
Read also: 16 Sales Dashboards That Make Sales Fun
Sales Report Examples and Templates
No matter how frequently your company aspires to begin publishing sales reports, this section is designed to guide you.
We’ll include plenty of templates and examples for daily, weekly, monthly, quarterly, and annual reports that should inspire your own.
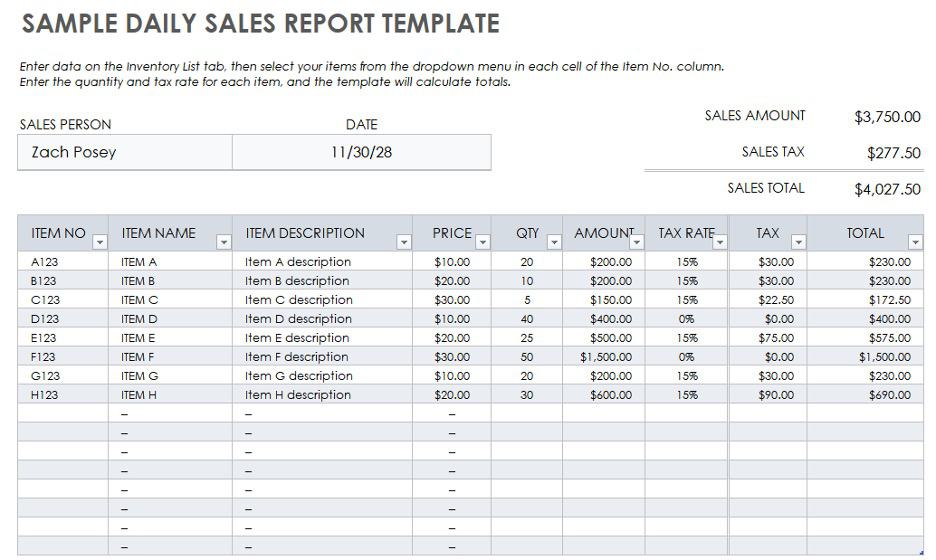
Daily Sales Report Template
First, let’s take a look at a daily report template.
This one is for an itemized list. You could use this template when listing new leads, sales rep performance, or closed versus open deals.
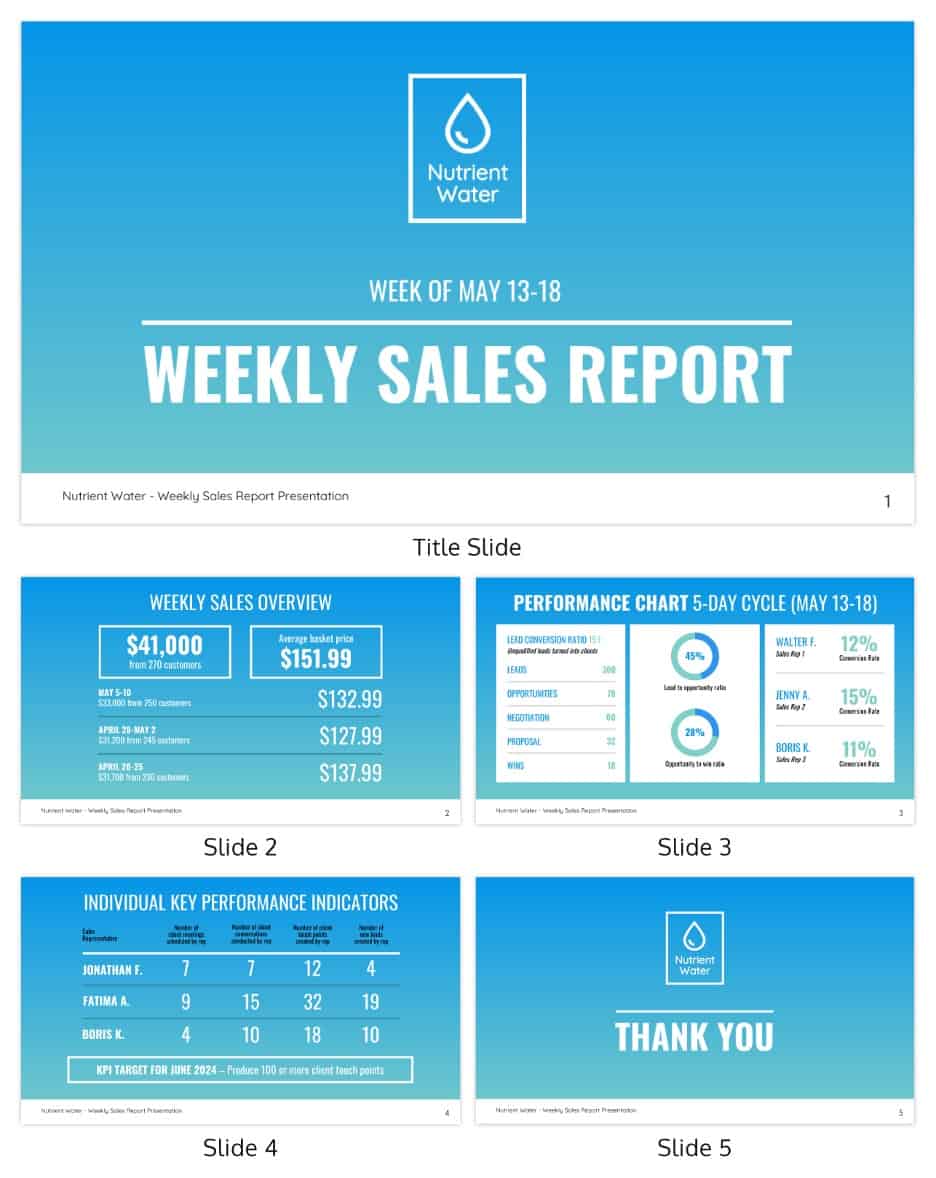
Weekly Sales Report Template
If you only publish sales reports every week, you need to go into more detail since you’ll have at least seven days’ worth of data to collect and report on.
This template organizes a wealth of information in a visually appealing format. The weekly sales overview goes into just enough detail that it doesn’t take up too much space in the report.
The performance chart breaks down the data further with more specifics, such as the number of leads, the number of sales opportunities, and the lead conversion rate.
This template also details KPIs by individual sales reps, so it’s sure to improve accountability among your team. The last slide, which is a thank-you, boosts morale.
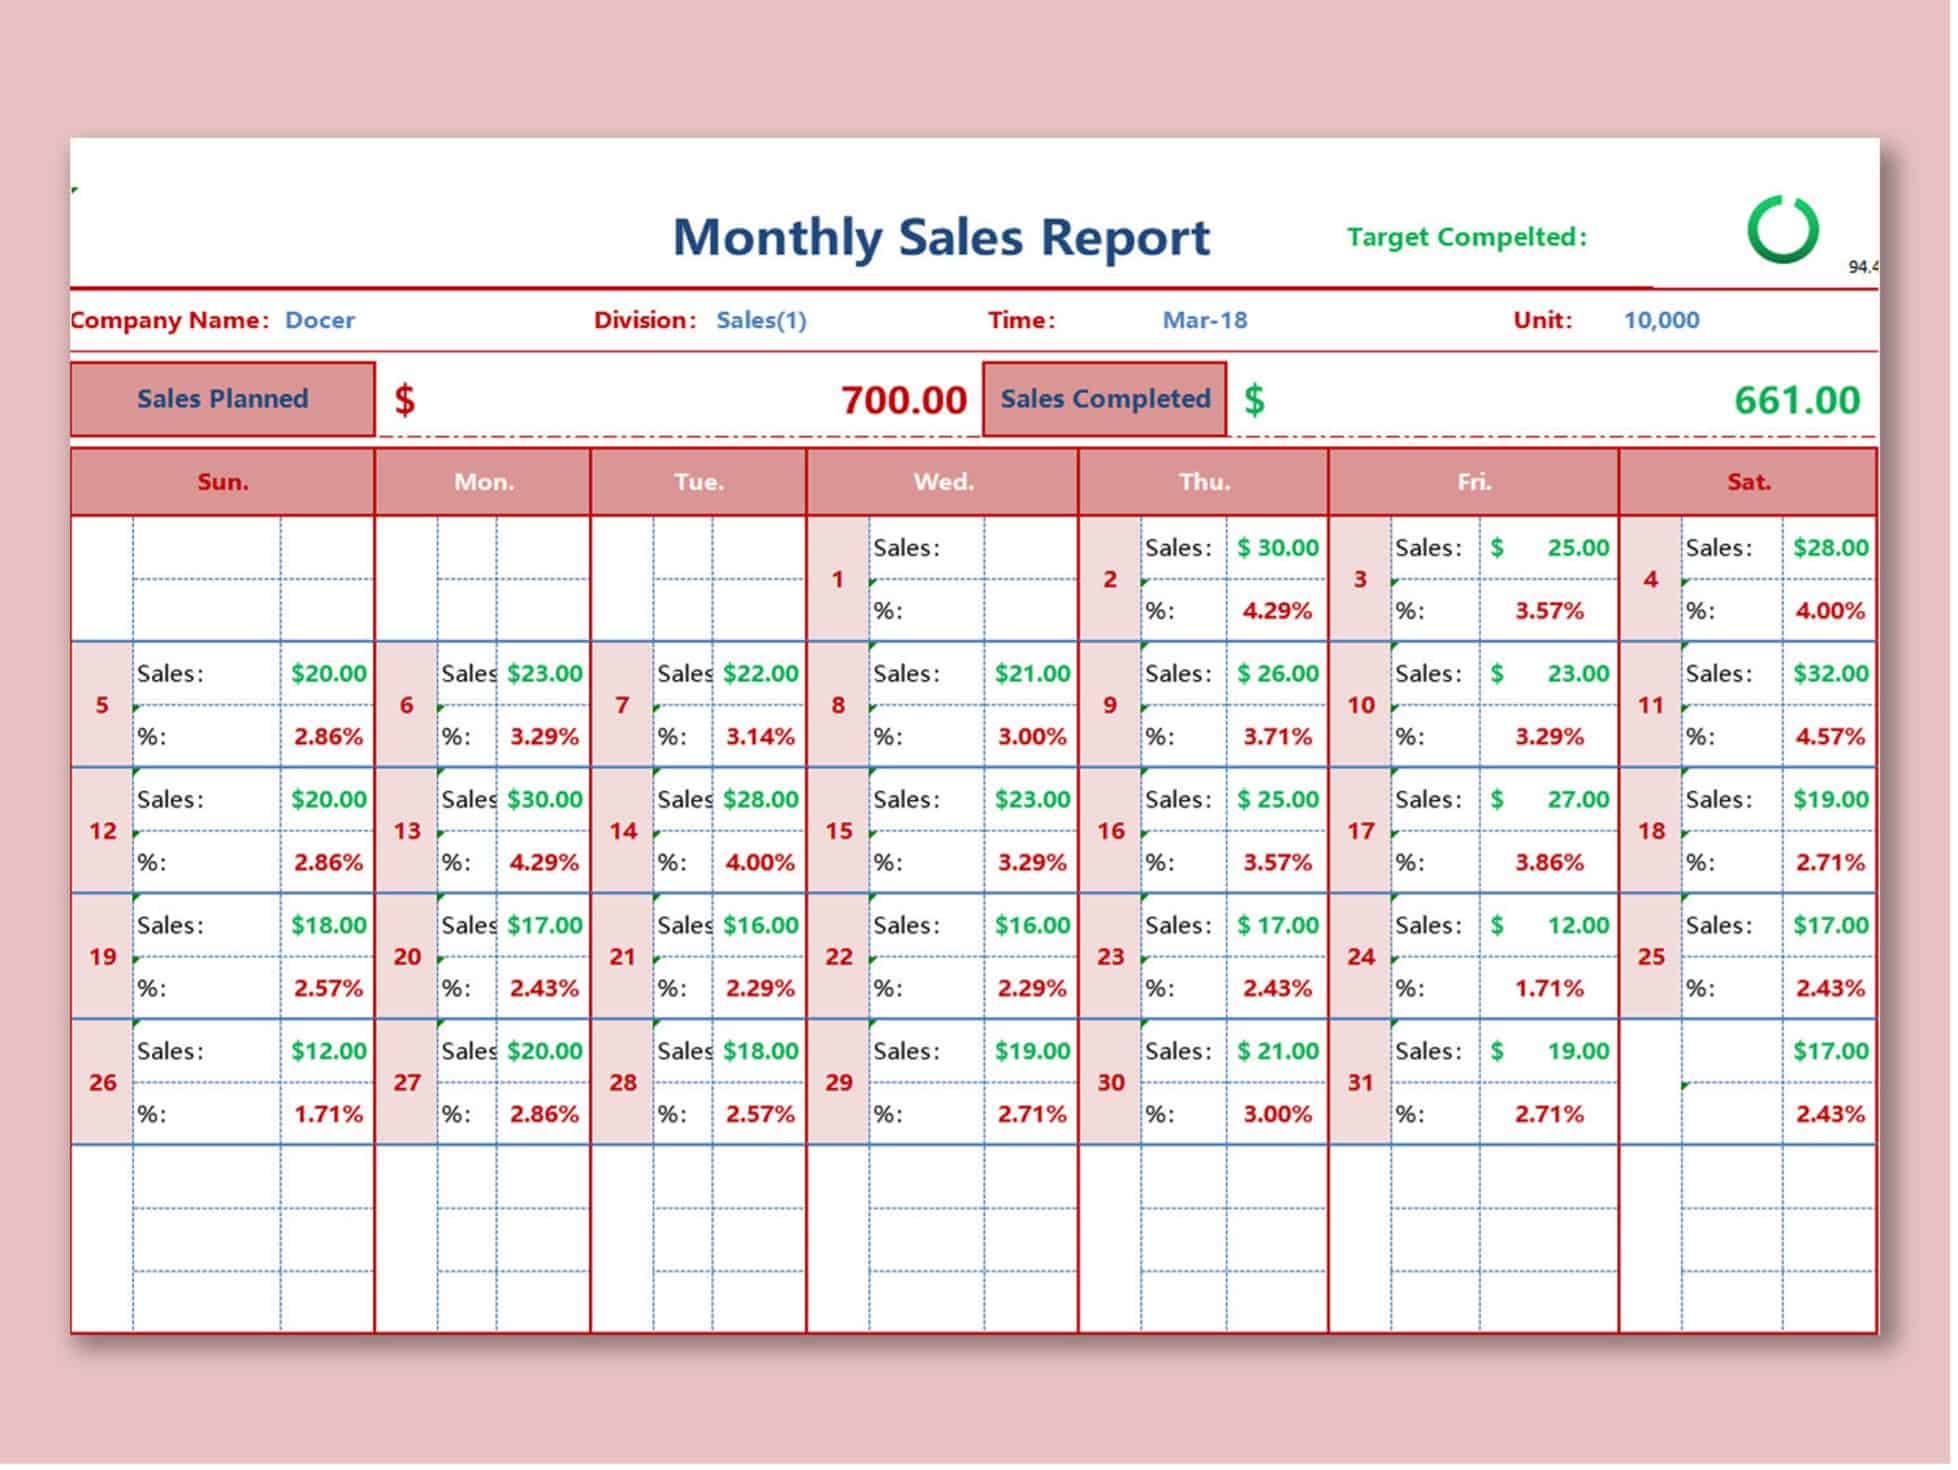
Monthly Sales Report Template
What if you only publish sales reports once a month? That’s fine, but you have a lot of data to comb through, so you must be thorough.
The following template shows monthly sales. While it could be one component of your reporting, you should include more of the metrics from above and present them in an appealing format.
Quarterly Sales Report Template
A quarterly sales report will be even more detailed still, as you’re breaking down a whole year’s worth (or half a year’s worth) of information into one report.
More so than ever, you’ll have to be good at presenting information concisely. The following example keeps a whole year of sales reporting neat so it’s simple to read through and analyze.

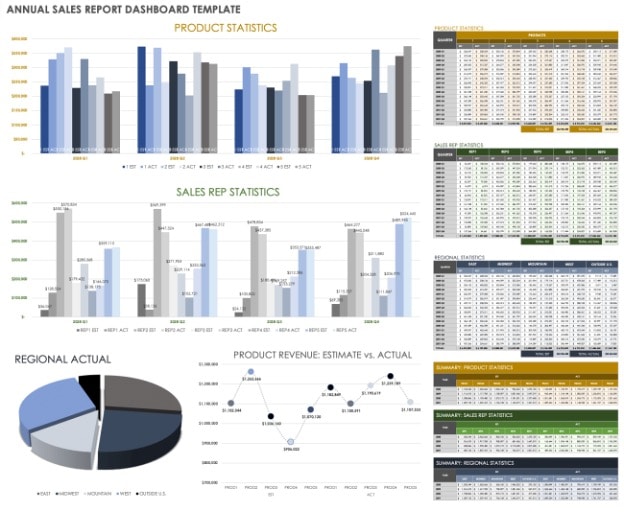
Annual Sales Report Template
For the companies that save their reporting for that big end-of-the-year or beginning-of-the-year data analysis, you’ll have the most data to parse through. It will take the longest time to produce your report, as you’ll have the most to share.
You need a concise, workable report template that keeps data categories organized to prevent information overload. This example should help you make your own reports.
Make Sales Reporting Easier with Collaborative Tools
By now, you’ve seen how daily, weekly, and even quarterly sales reports can be structured with templates. But sometimes, the challenge isn’t knowing what to include—it’s putting it all together in a way that your team can easily access, edit, and keep updated.
That’s where a tool such as Bit.ai is useful. It enables you to make clean, interactive sales reports to share with your team in real time. Whether you’re keeping everyone on the same page across departments or even prepping content for a guest post, Bit.ai simplifies collaboration.
In addition, its integrated AI document editor can also assist you in speeding up the formatting and writing process, so your reports are professional without requiring you to put in extra hours of work. Saving time is not all, though, as it also maintains your reporting process consistent and professional.
Read also: What Is Sales Volume? 8 Strategies to Boost Your Revenue
Conclusion
Daily sales reports can tell you a lot about your company, from how your individual sales reps perform to the achievements of your sales team as a whole. You can also learn more about your sales funnel, rectify issues with that, and gauge which selling tactics, products, and services perform best.
There’s no wrong frequency to produce sales reports, as each has its advantages and disadvantages. Daily sales reports take the most time each day but save you from having to produce mega reports once every few months or even once a year.
Quarterly or annual reports are huge, but you won’t work on them nearly as often as daily or weekly sales reports.
No matter which sales reporting frequency you choose, we hope that you keep getting better at making sales and touch the sky the soonest you can 🙂
If you need a sales tool that costs peanuts, check out the world’s most affordable CRM: EngageBay.