
Do you manage a sales team? Have you ever wondered how successful sales leaders keep track of their team’s performance?
As a sales manager, it can be quite overwhelming to monitor the progress of each sales rep, track key metrics, and make sure everybody achieves their sales targets.
With a sales dashboard, however, you can track the sales performance of your team and stay on top of things with much less effort and confusion.
A sales dashboard helps you understand whether your sales reps are meeting their revenue targets. This allows you to plan ahead, in terms of decision making, determining the compensation and bonuses, and addressing any bottlenecks in their initial stages.
With the right sales dashboard, you can visualize your sales team’s performance for any given time period, gather sales data from various sources, and summarize it all into a single report.
Today, most sales reporting platforms come with built-in sales dashboard templates that can create visual reports of your key performance indicators (KPIs).
In this blog post, we’ll show you 17 sales dashboard examples that can help you get started.
Table of Contents
17 Sales Dashboard Examples to Make Sales Exciting
Most of the dashboards we’ve presented here are generated from EngageBay, but not all.
If you like any of these, feel free to try EngageBay as your sales tracking tool — you’ll get a conversational inbox, customized reporting, goals, call scripts, proposals with analytics, in-app calling with auto dialler, call records, sales automation, leaderboard, and more.
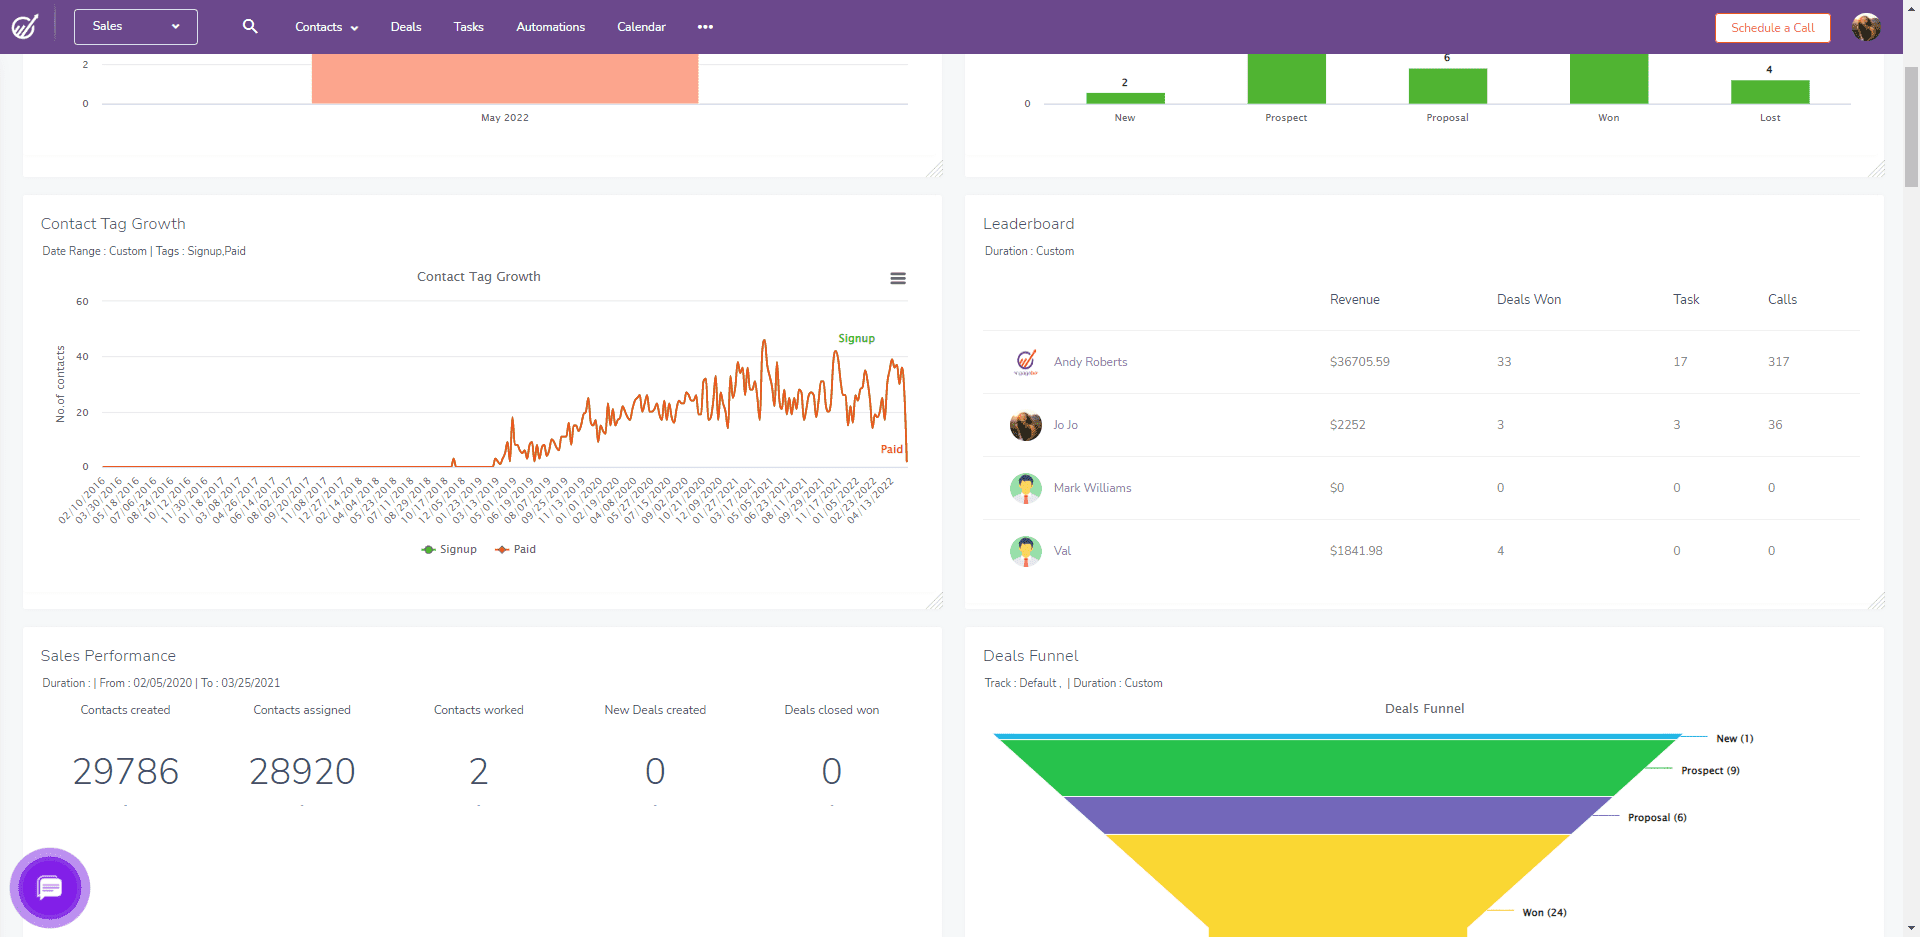
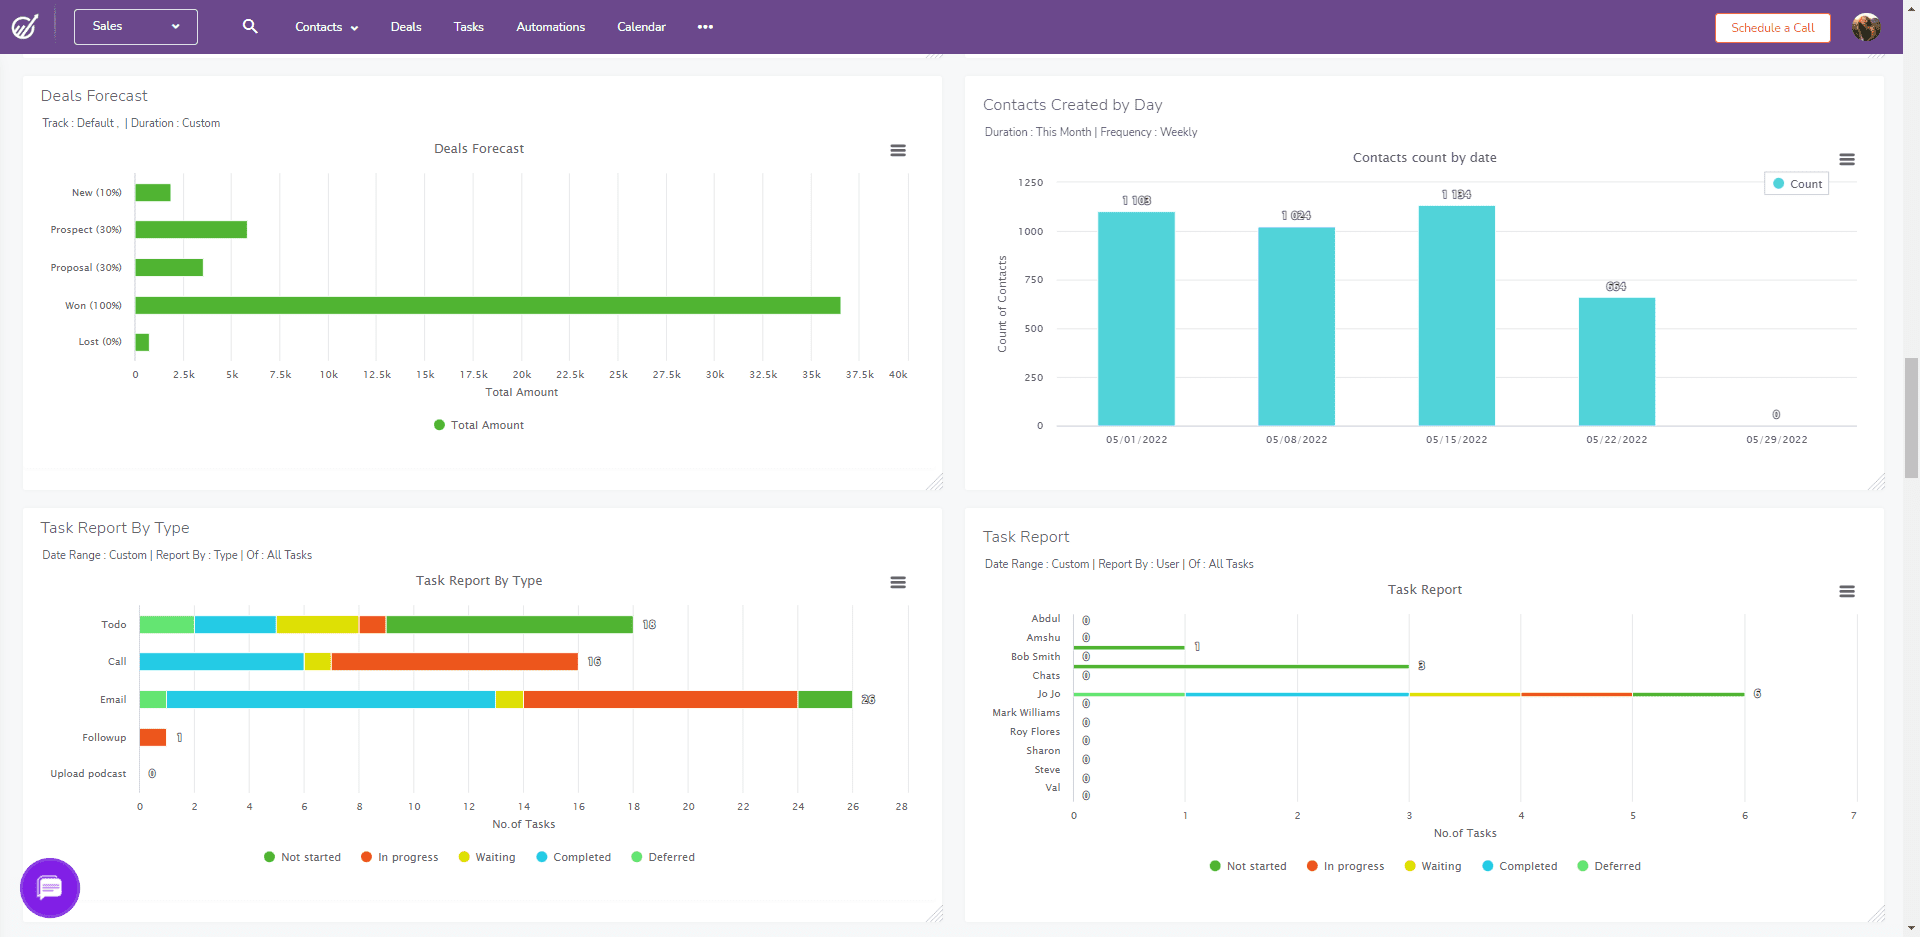
#1. Overall Sales Performance Dashboard
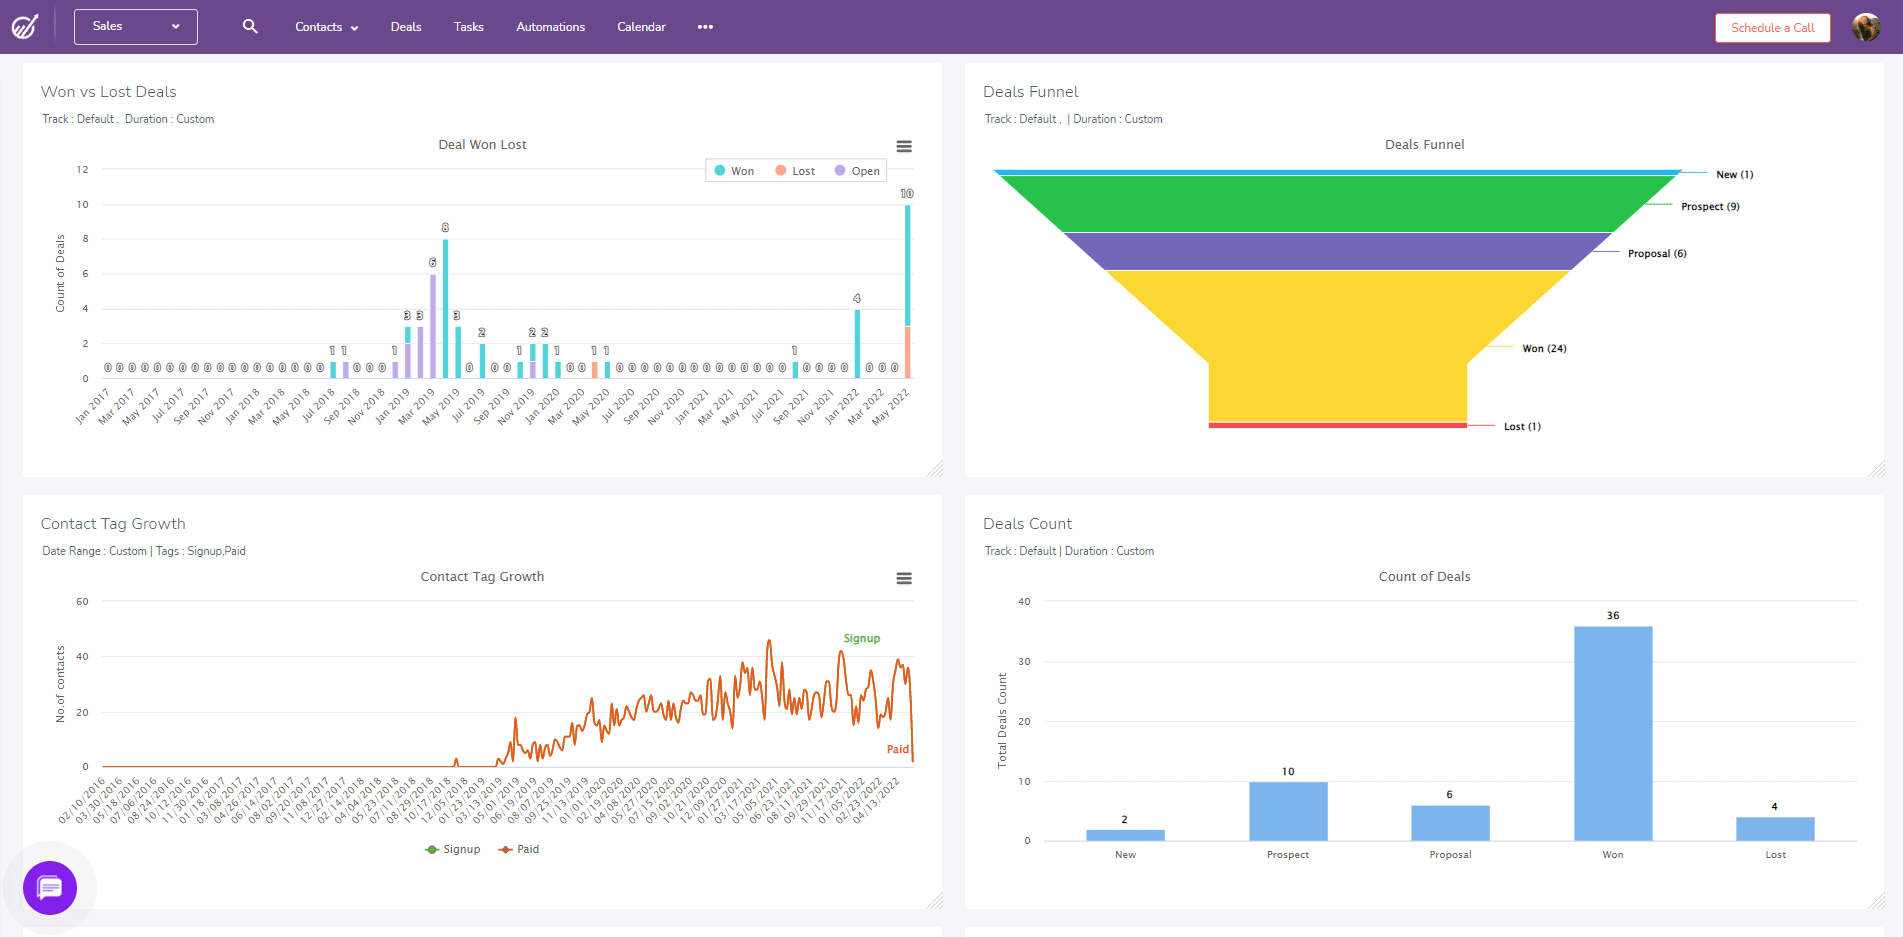
If you are looking for a platform that shows all the aspects of your sales performance, an overall sales performance dashboard works best.
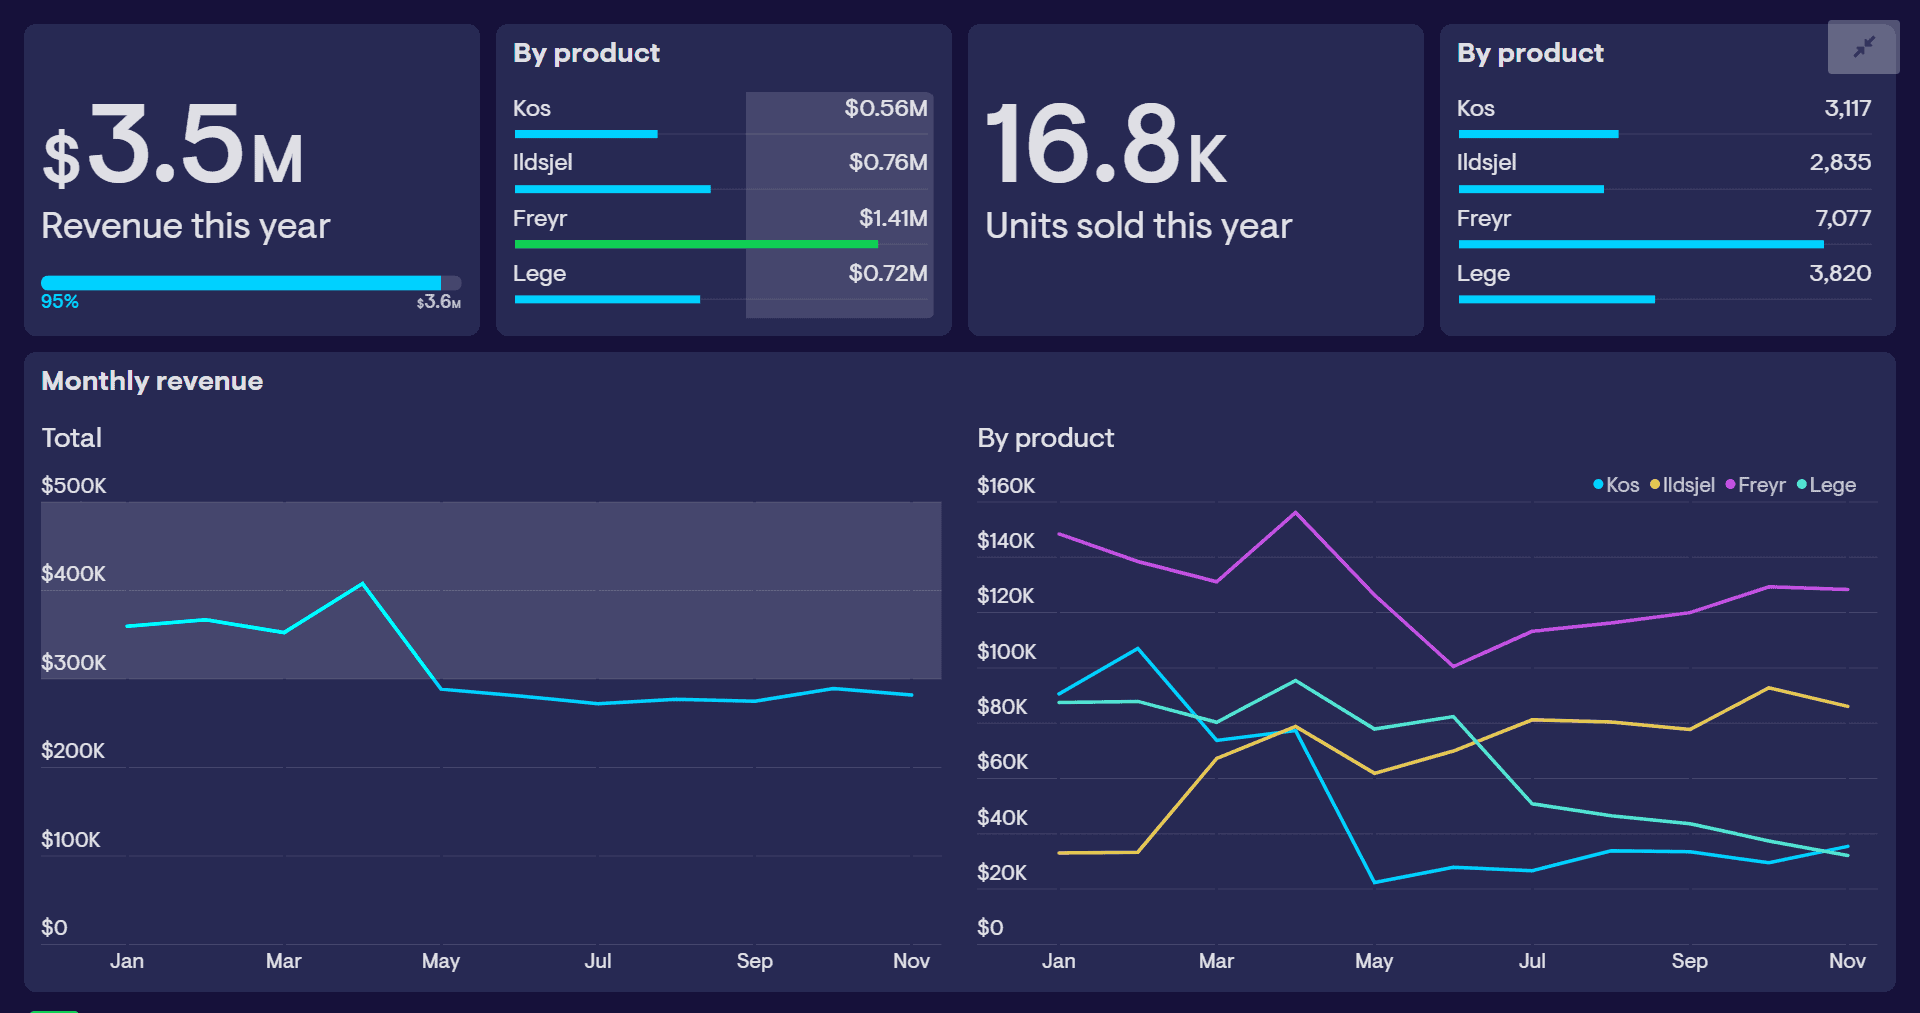
The sales dashboard example here displays all the information that your business might require to assess sales performance, including the revenue generated by each sales rep, month-over-month growth, sales pipeline breakdown, monthly revenue forecast for each product or service sold, and the sales pipeline for every team member.
Moreover, the overall sales performance dashboard shows you insights based on the most important metrics determined by your company and determines whether your sales team is on track to achieve their targets.
The data has been presented in a digestible and easy-to-understand manner, through the use of bar charts.
#2. HubSpot’s Template Library (130 Templates)
If you’re looking for templates that help various aspects of your business, especially sales dashboards, HubSpot’s collection of 130 business templates is a great source. You can find templates for you’re an agency, freelancer, marketing professional, customer service executive, sales representative or a startup founder.
You can sort templates by various categories to find the template you want. For businesses large and small, you can find templates for all your needs. You can manage your financials using balance sheet templates, business budget templates, and invoice templates to send to your clients.
The proposal templates will help you with advertising, bidding, annual reports, and more. These templates will help you present and document anything related to your business, professionally.
Even if you’re planning to start a business, you can find templates for that as well. These templates will help you set goals for your business, plan your budget and strategize.
For tracking your sales, you can make use of the sales specific templates and track data, patterns and trends. Since these dashboards are created on Google sheets, you can collaborate with anyone in your team and expand the value these templates can create for your business.
#3. Upcoming Tasks Dashboard
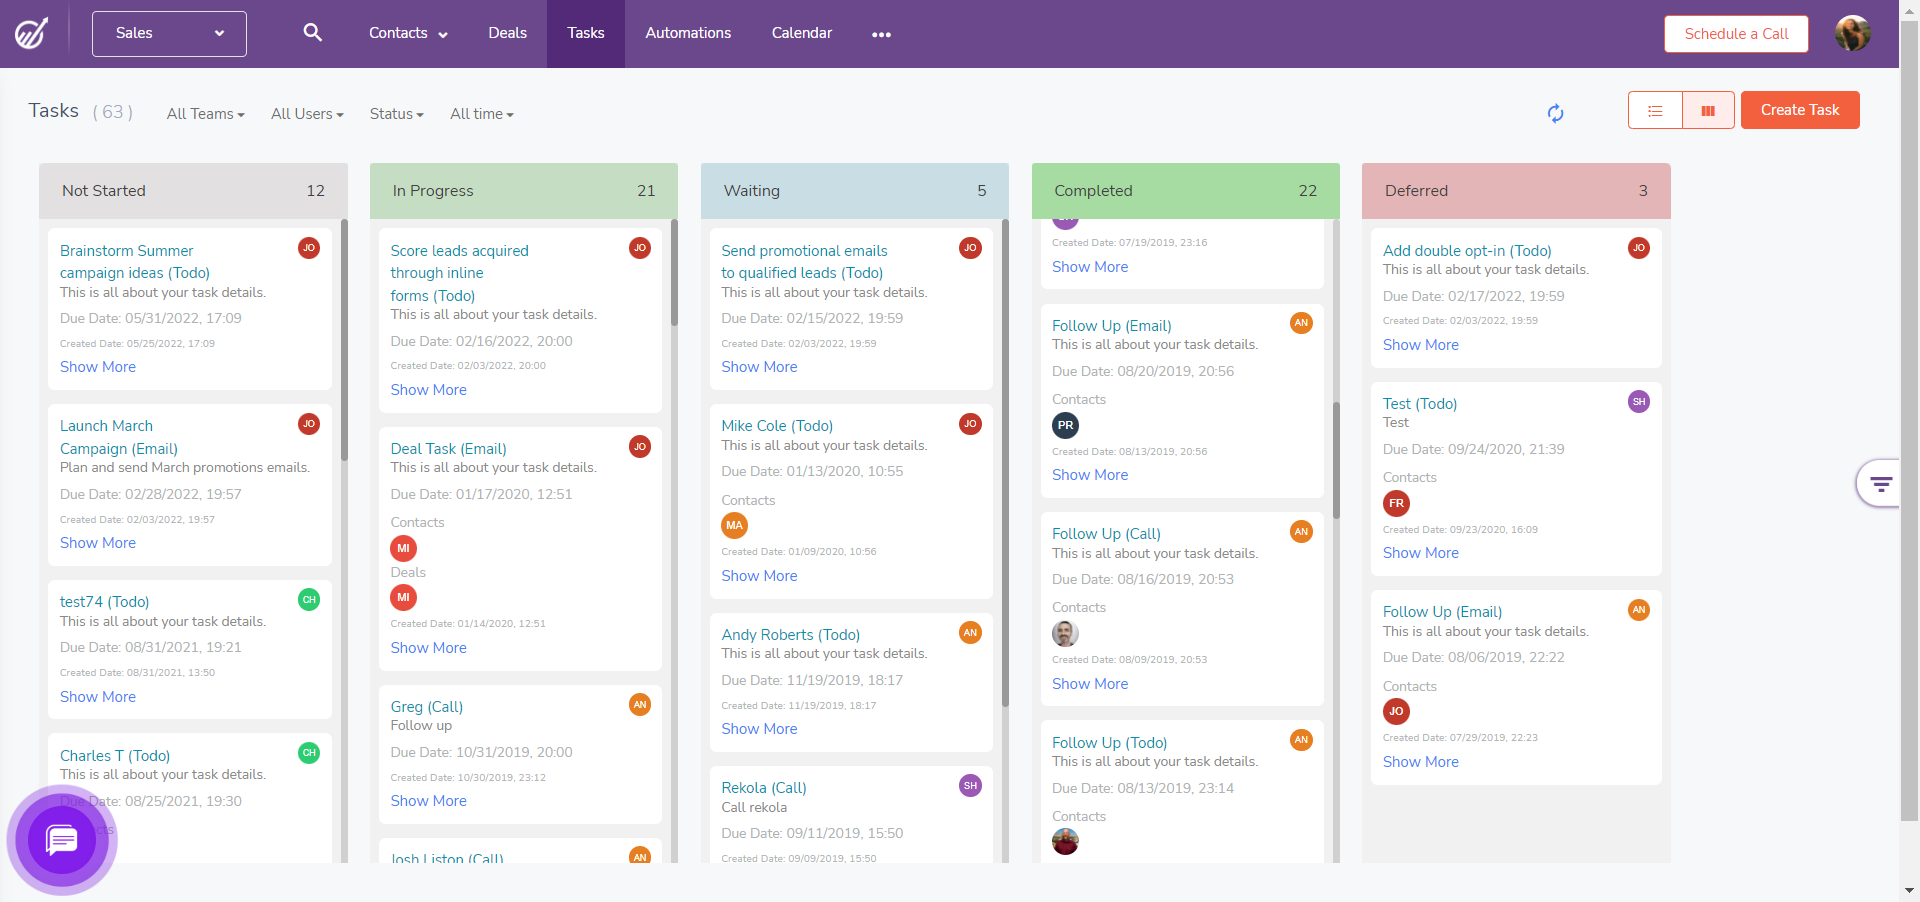
Want to know how to keep a track of future tasks and deadlines? That’s right, with the help of the upcoming tasks dashboard.
The above image shows how a sales representative can keep a tab of the things they need to do, the number of open tasks, and the due dates for the completion of these tasks.
It also shows the work that is in progress and the different stages that each task is in.
By having an upcoming tasks dashboard, sales personnel can build their daily and weekly schedule, and know which tasks need immediate attention and those that can be done later.
It also saves time for sales managers, as they don’t need to send constant email reminders for deadlines or ask their teams regarding the status of various projects.
5 Sales Tools and 6 Sales Techniques That Always Work
#4. Sales Leaderboard Dashboard
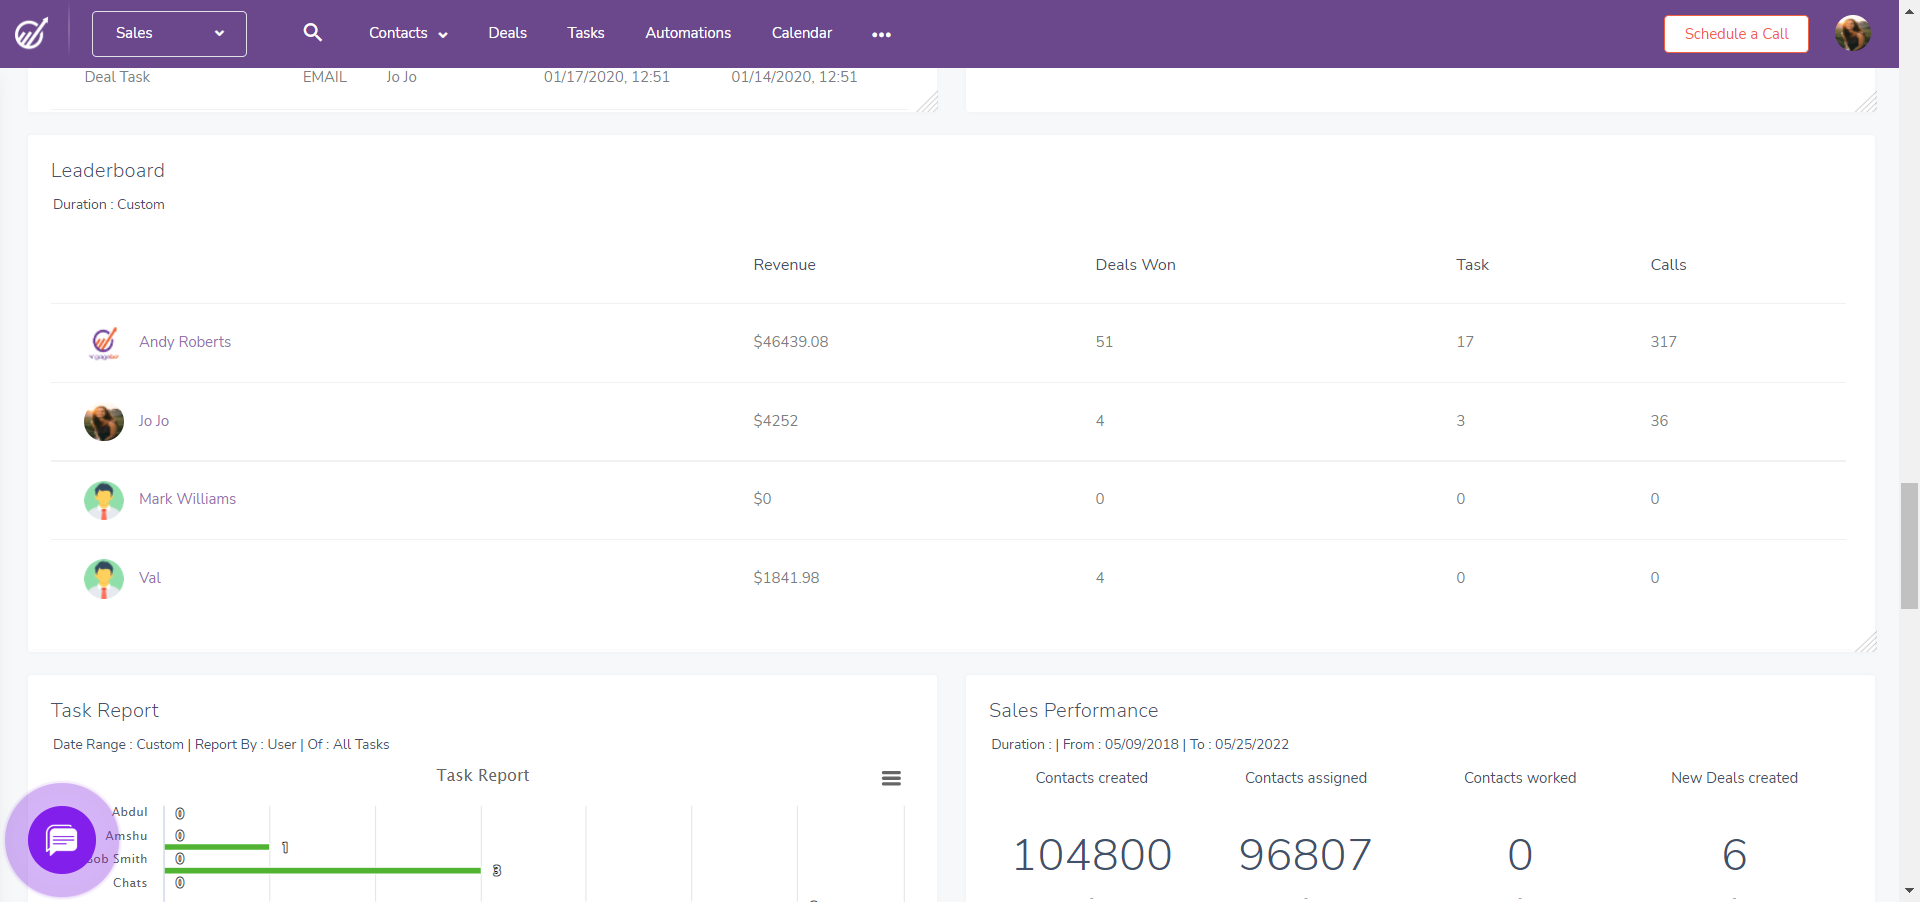
Do you wish to promote some competition among your team members?
A sales leaderboard dashboard helps you do exactly that.
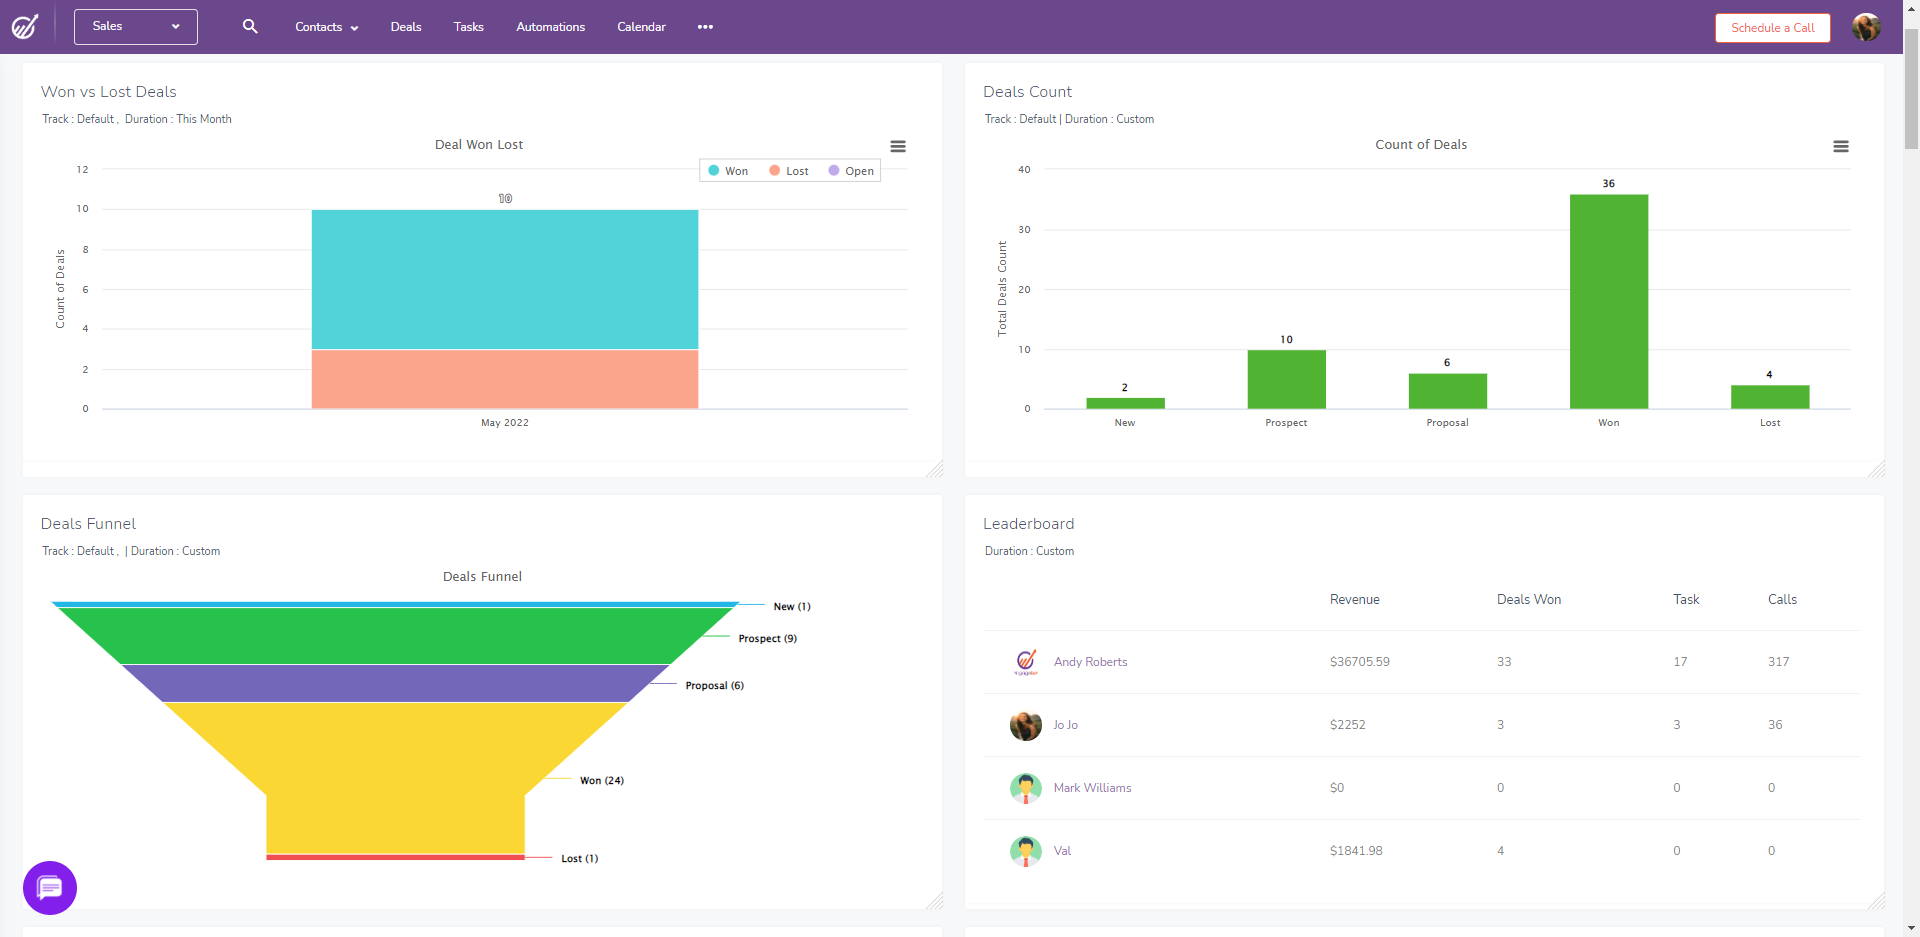
A sales leaderboard lets you rank your sales reps based on the number of deals sealed by them, the revenue that they have generated, the number of calls made, and how many tasks were accomplished, in a given period of time.
As a result, employees are further motivated to perform better and more efficiently, which, in turn, leads to greater revenue and more deals for the organization.
It may also help sales managers track underperforming employees, and discuss steps to improve their sales performance.
#5. Product Performance Dashboard
If you are interested in gathering revenue data product-wise, the product performance dashboard is something you should look at.
Here, you will get a breakdown of the different ways by which sales were generated. The dashboard makes use of pie charts, bar charts, and line graphs to demonstrate how a firm earned its revenue in a particular period.
The example shown here shows the products that brought the most revenue, along with the sales generated online versus in-store, the breakdown of the cost of goods sold month-wise, and campaign-wise incremental sales.
The data has been displayed in the form of various charts, helping you and your team members grasp information quickly.
 Discover the most effective sales analysis strategies that will transform your sales performance in our detailed article!
#6. Field Sales Mobile Dashboard
Is your sales team always on the move? If yes, then the field sales mobile dashboard will be useful for you.
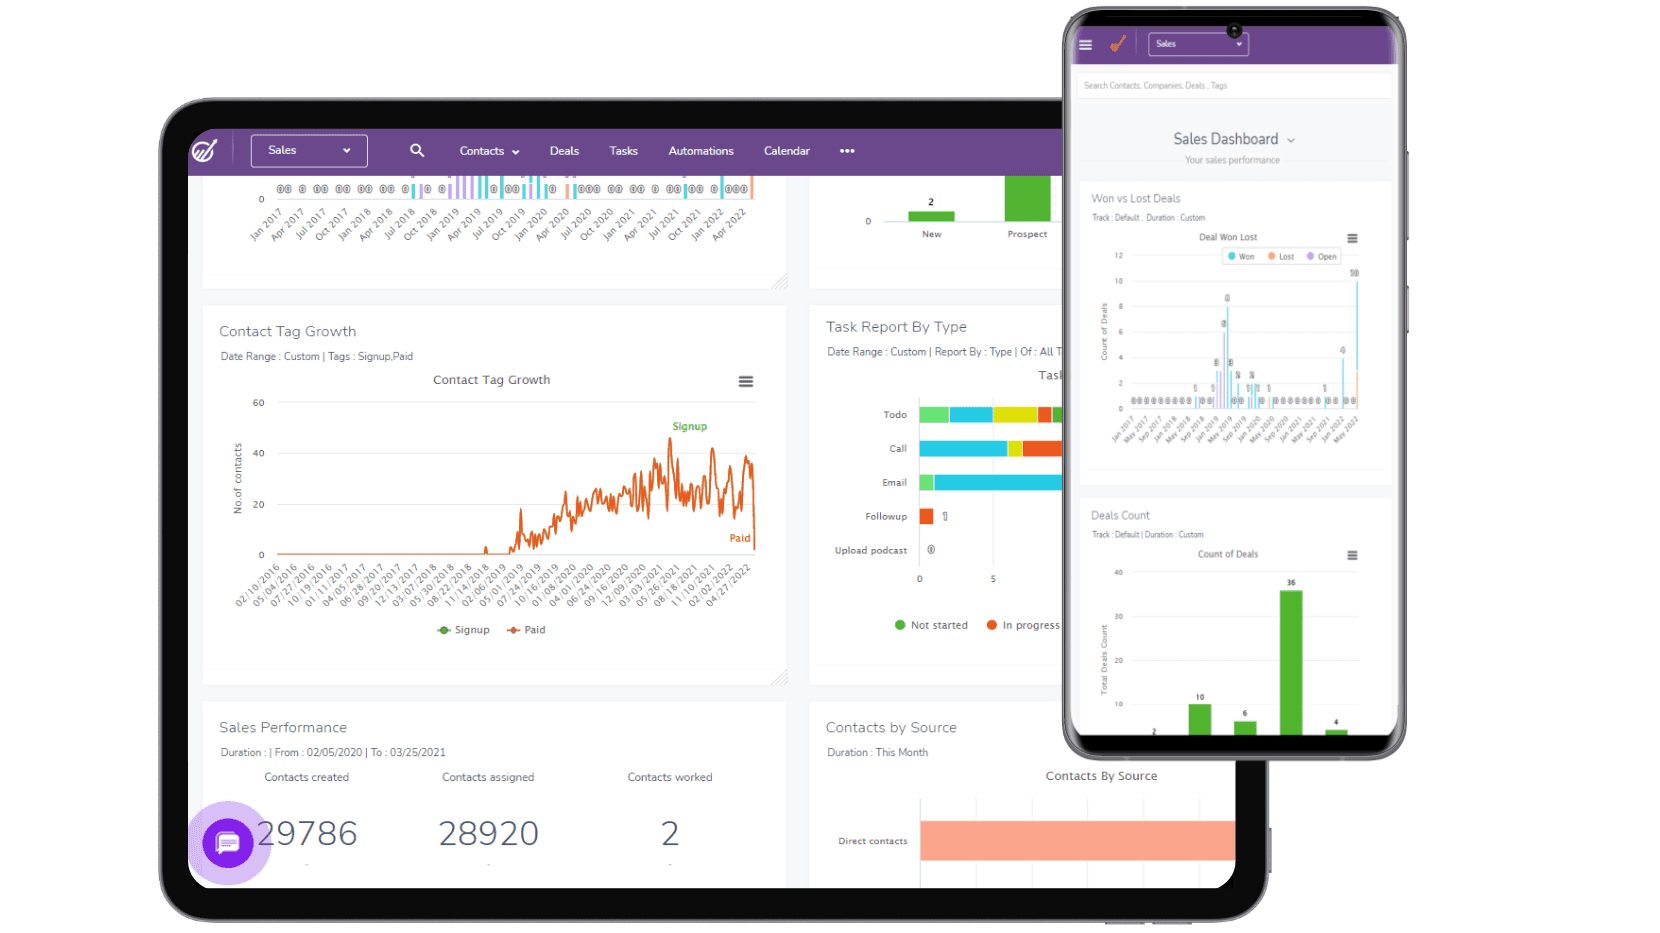
Zoho’s sales dashboard helps you and your reps to track their sales performance outside the office as well. Be it on the field or in the office, have a mobile-responsive sales dashboard that can visualize sales performance anywhere and at any time.
The field sales mobile dashboard optimizes the platform to show you the relevant sales data on your smartphone, including upcoming tasks, deadlines, customer interactions, calendars, and related sales activities.
Inside vs Outside Sales – Their Pros and Cons, Structure, Tools
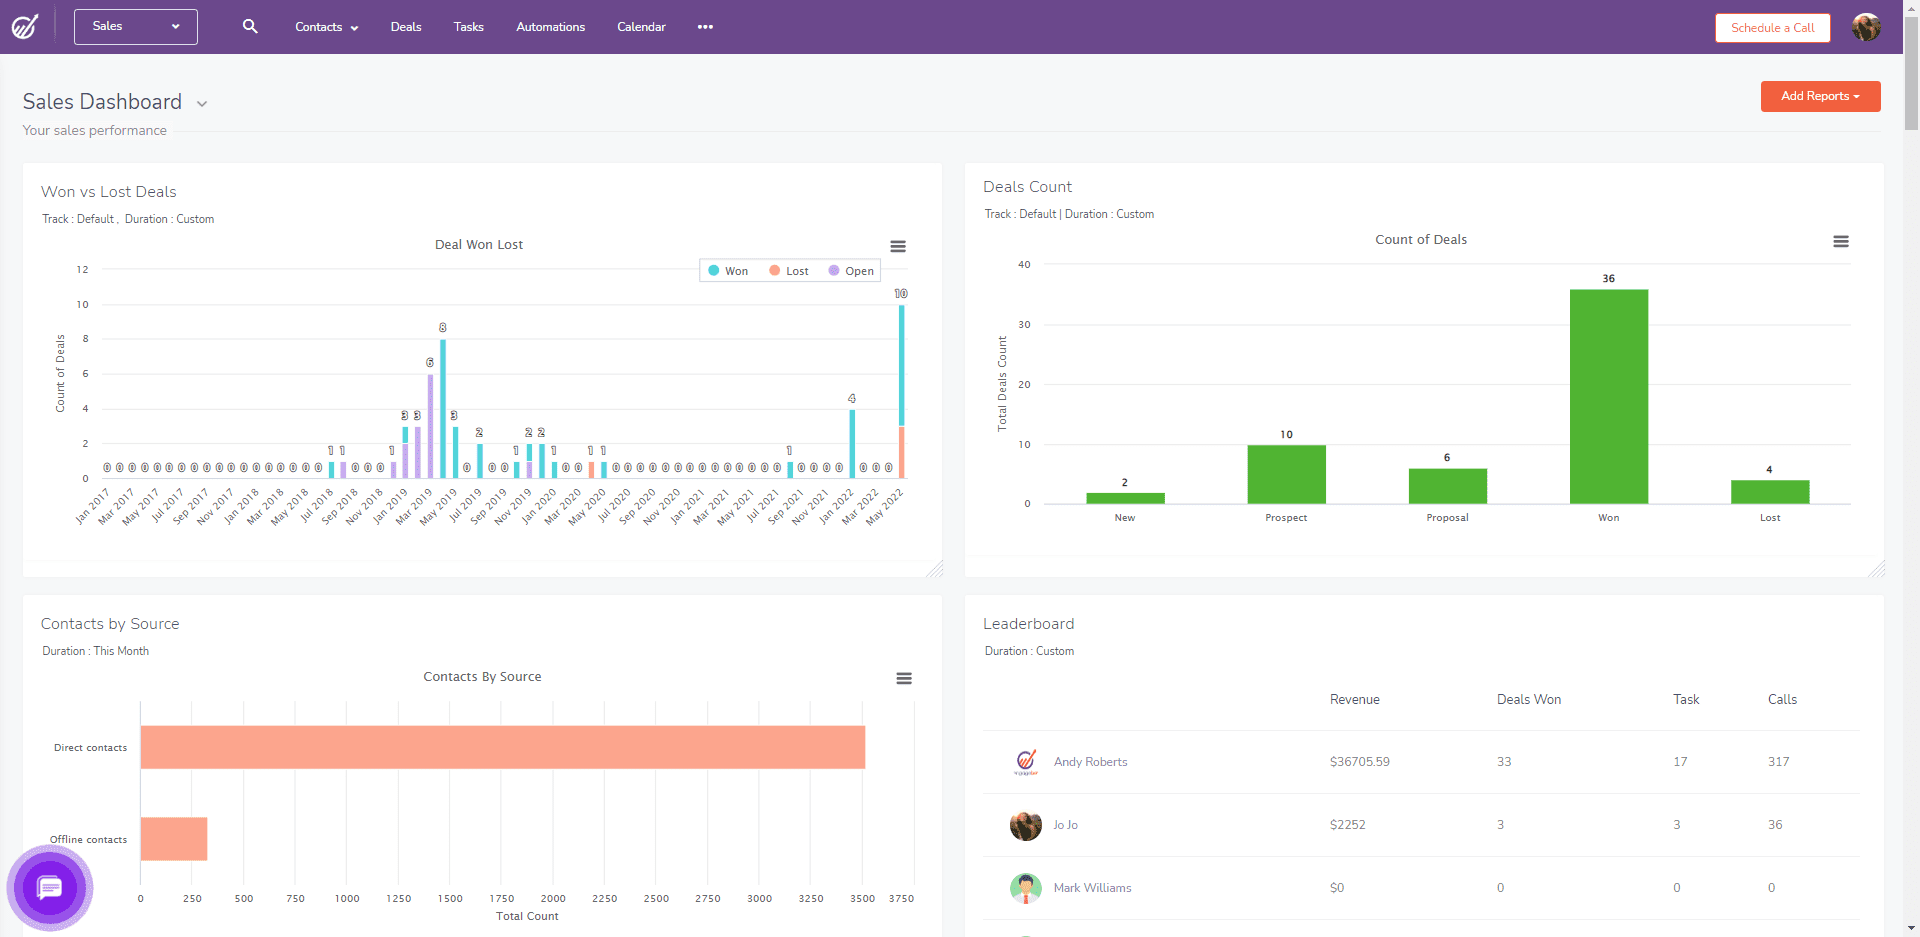
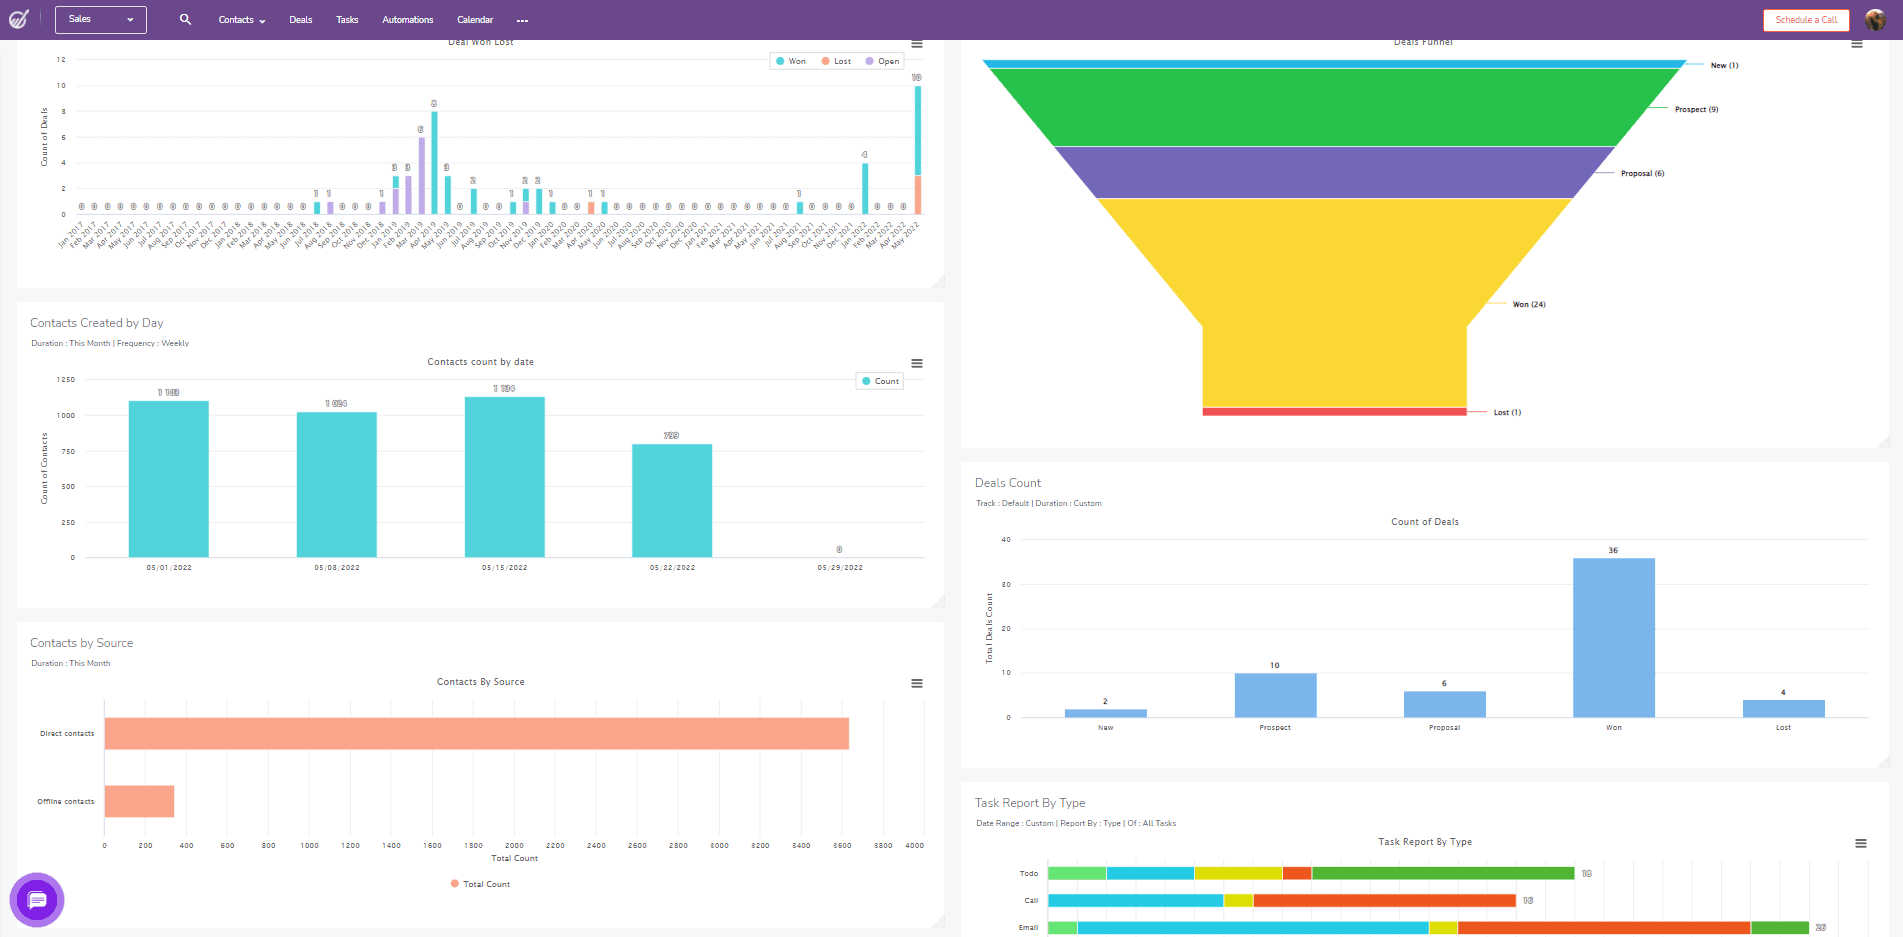
#7. Win/Loss Dashboard
For a sales manager, an important indicator of performance is the number of deals that were closed in a given time period.
The Win/Loss dashboard helps you with exactly that. This sales dashboard example shows you the overall value of deals that were made at a particular time, along with the value of deals that were won or sealed and the value of deals that are still in progress.
Further, the platform helps you track the deals made by every team member, along with the number of deals sealed and those that are on hold.
This helps you identify any areas for improvement and how you can close deals faster. Moreover, it can also enable you to monitor sales performance employee-wise, and find reasons why some reps are underperforming.
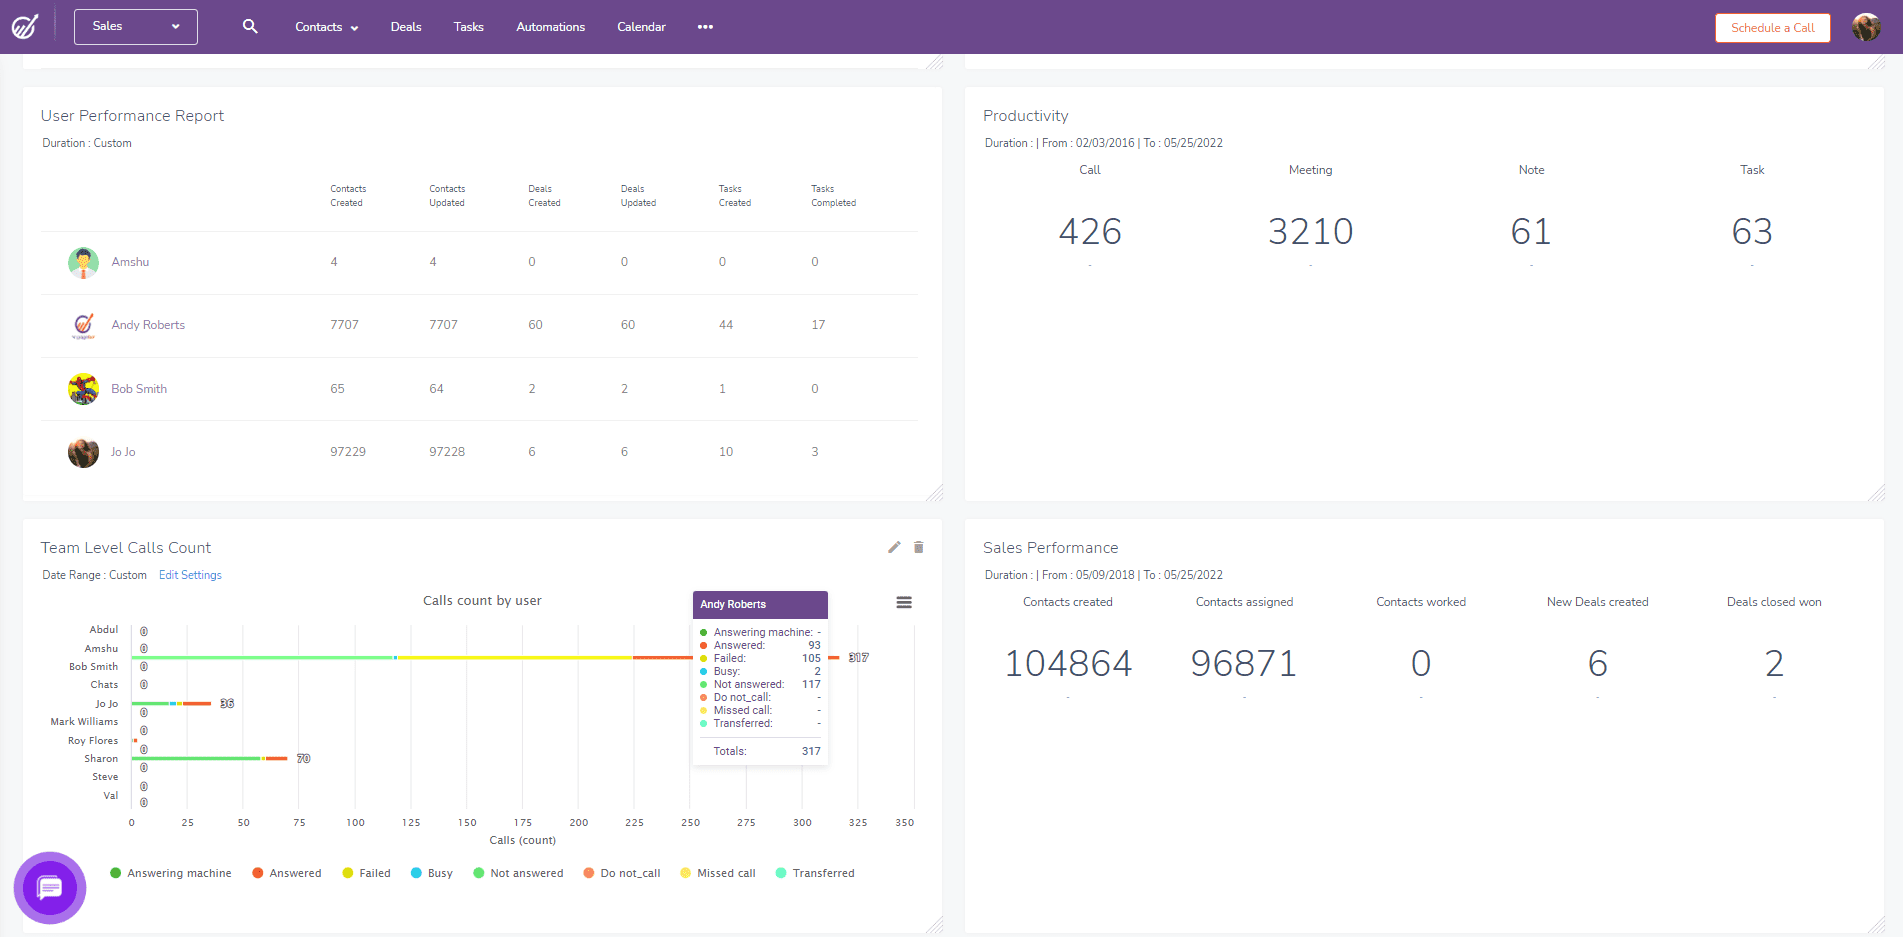
#8. Sales Activities Dashboard
If you are interested in finding out what your sales team members do during the day, the sales activity dashboard is what you should look for.
The sales activity dashboard provides an overview of what your sales reps are doing during their work hours.
The dashboard shows a collection of pie charts and visuals depicting the sales activities undertaken by your team.
This includes the number of deals created, calls made, the number of emails sent, and how many activities were conducted for every deal made.
Boost your sales by understanding the true essence of strategic selling. Dive into our comprehensive guide now.
#9. Time Tracking Sales Dashboard
Another way to track your sales team’s activities is by using the time tracking sales dashboard.
This dashboard is particularly useful for companies that have sales reps who are always on the go.
It helps organizations track where their sales personnel are spending the maximum and minimum amount of time, and how much revenue they are generating as a result.
You can also get data on which clients your team is working on the most, and the number of billable hours as a result.
Boost your sales performance with effective lead management. Explore our comprehensive guide to get started.
#10. Sales Performance Dashboard
If your firm has operations across multiple regions, it is best to use a sales dashboard that provides a visual representation of sales performance region-wise.
The dashboard provides you with information regarding the region that is generating the most sales versus the region that has the least sales.
It also gives you insights into which products are being sold the most, along with a visual representation of the products that are sold the most for each territory.
The Most Important CRM Metrics for SMBs
#11. Top Performing Sales Dashboard
To find out which clients have generated the most revenue, the top performing sales dashboard is suitable.
Using the top performing sales dashboard, you can find out which customers or accounts have resulted in the maximum value of sales during a particular period of time.
This also helps you understand which products customers are buying the most.
Accordingly, you can create and implement sales strategies to generate more sales from the highest-performing accounts, and find out ways to re-target inactive customers.
It will also help you reframe your marketing plans in case the top-performing customers are not generating many sales.
#12. Deal Performance Dashboard
To get insights into sales analytics, you should use the deal performance dashboard.
Under the deal performance dashboard, you will get all the information that you need regarding the deals that have been closed and those that are expected to close in the future.
The dashboard also provides data on any pipeline changes that took place during a particular period of time, deals closed per team member, and the number of deals at every stage of the sales process.
7 Sales Management Tools to Build the Perfect Sales Team
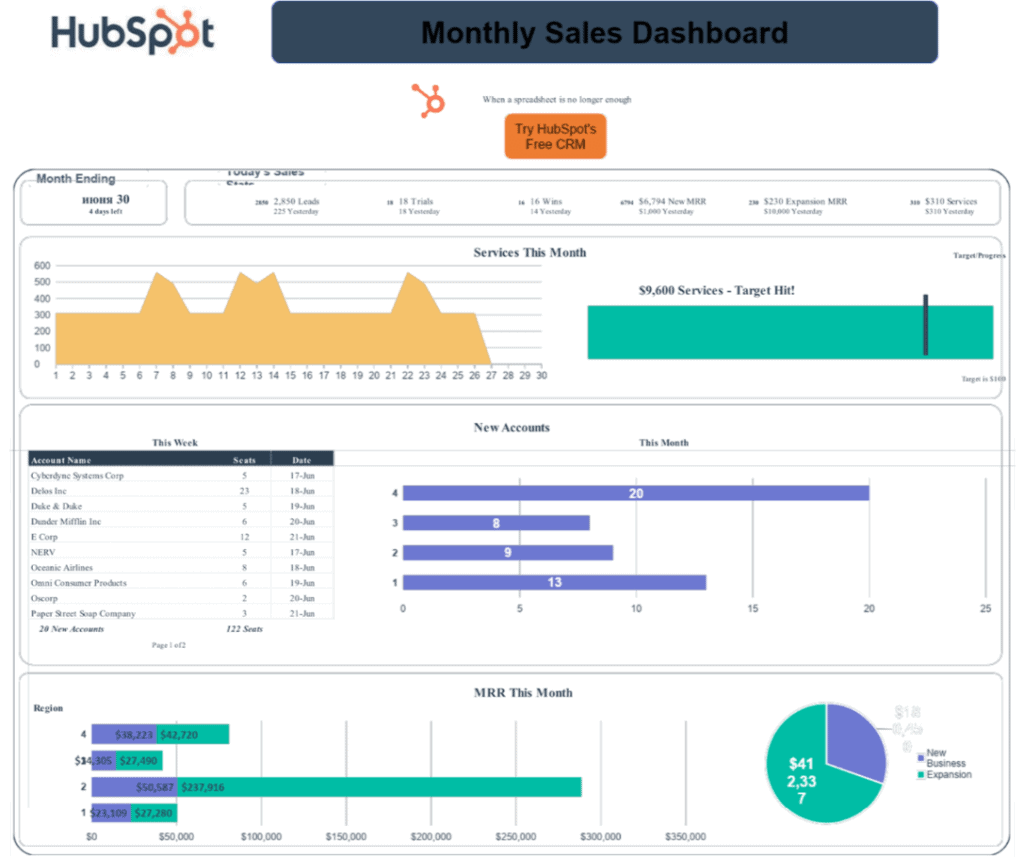
#13. Sales Manager Dashboard
For a sales manager, it is crucial to keep a track of how their team is performing, and accordingly redesign the sales process.
With the sales manager dashboard, managers can have an overview of their company’s sales performance daily, weekly, or monthly.
Using the sales manager dashboard, leaders can visualize the number of new accounts acquired, the number of deals closed versus the number of targeted deals, and the monthly recurring revenue (MRR).
For businesses that have operations across different regions, the data on wins by region is also available.
#14. Sales KPI Dashboard
The sales KPI dashboard is one of the most important forms of sales dashboards for sales and marketing teams.
A sales KPI dashboard helps you track high-level sales metrics that emphasize operational and strategic data necessary to run the organization while improving the quality and performance of sales targets.
Using a sales KPI platform, companies can track the number of sales made, any new revenue generated, profit earned through sales, and a breakdown of the sales and marketing expenditure.
What’s more, you can review employee performance directly using the sales KPI dashboard, as it provides data on the sales and profit generated by individual sales reps.
16 Key Sales KPIs for a Revenue Boost
#15. Sales Cycle Length Dashboard
With the sales cycle length dashboard, you can find out the average number of days, weeks, or months it takes for a sales rep to identify a lead and convert them into a customer.
If you are looking to shorten and make your sales cycle more efficient, this dashboard is ideal for you.
Not only can you find out and address any bottlenecks that might be increasing the duration of your sales cycle, but also access data regarding the lead conversion rate and cycle length for each sales team member.
Top 11 Sales Tools For Effective Lead Generation
#16. Sales Forecasting Dashboard
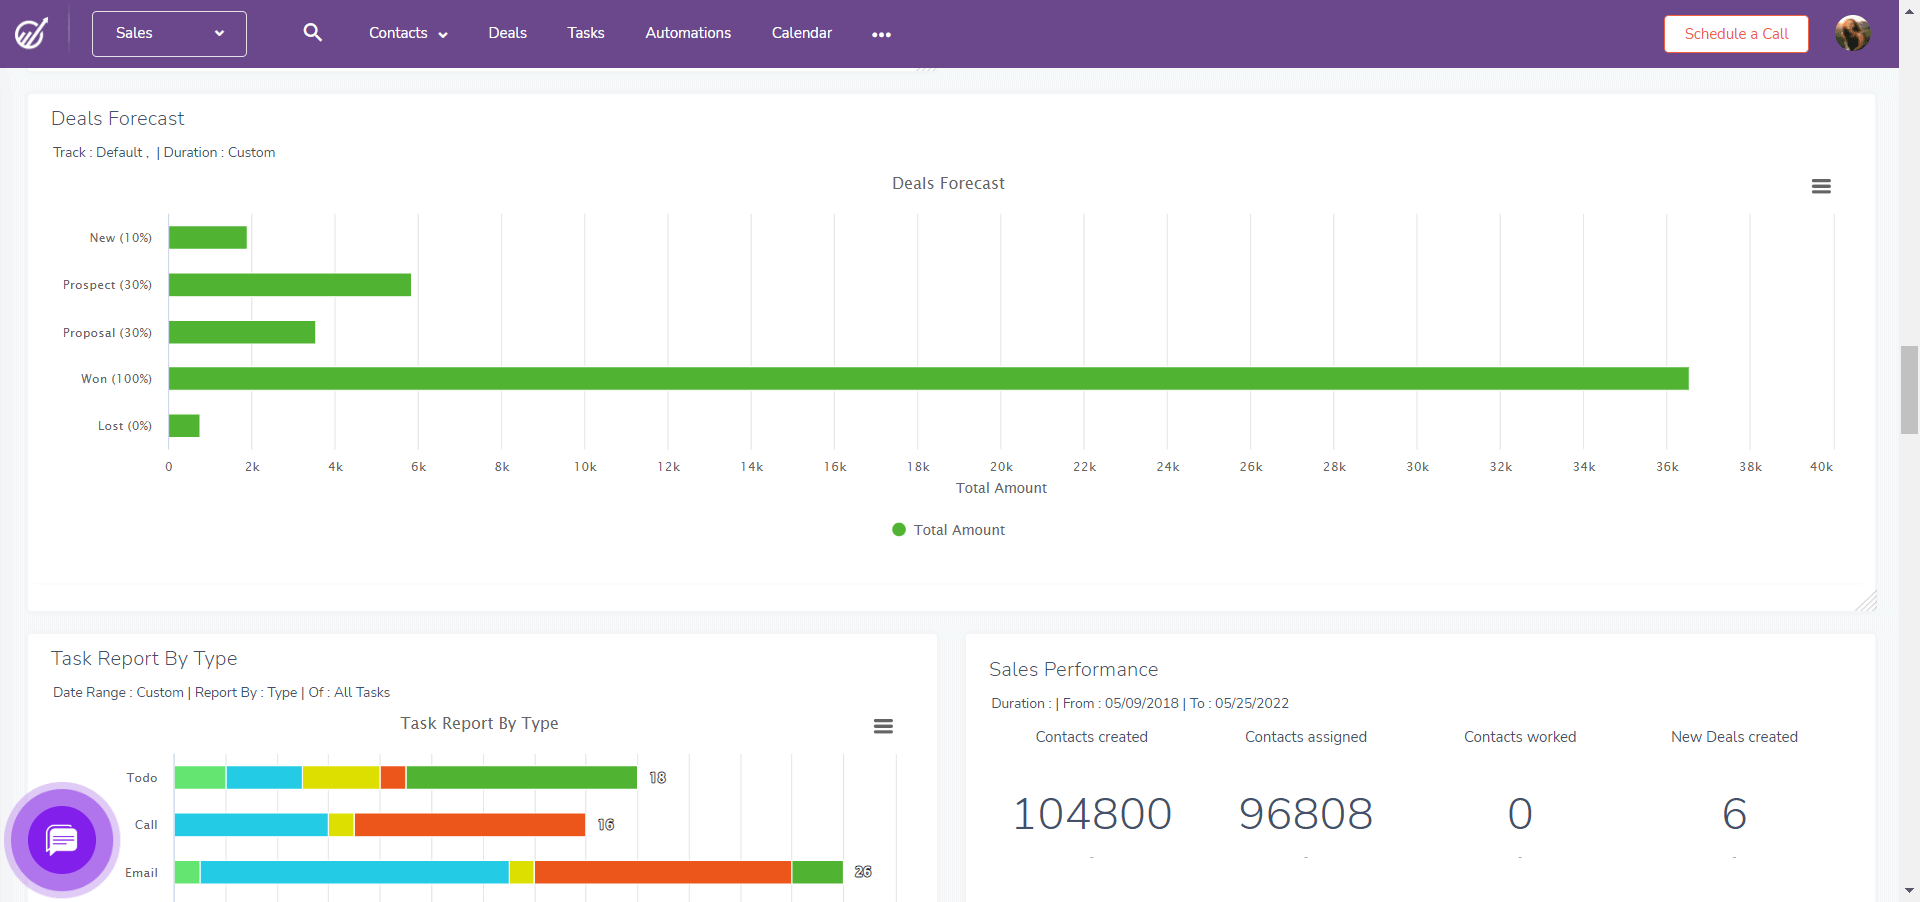
The sales forecasting dashboard set up as a sample in EngageBay helps sales teams and managers plan for the future.
It provides an insight into how revenue and sales can increase or decrease within a given period of time.
The dashboard also helps you compare your current pipeline to your future targets, and accordingly address any bottlenecks that might be preventing your team from achieving their sales goal.
#17. Sales Opportunity Dashboard

If you are looking to explore how to expand your customer base and close more deals, the sales opportunity dashboard works best for you.
Using this dashboard, you can track the number of sales opportunities available by region along with their valuation, and currency opportunities available.
It also shows the potential revenue that you can gain by acquiring new customers, and you can generate member-wise sales data across regions. You can also see the opening and closing ratios for each salesperson.
What is Sales Velocity and How do You Measure it?
How to Create the Perfect Sales Dashboard
Now that you have looked at some examples of sales dashboards, it is time to create your own.
Here are some tips to help you get started.
#1. Decide the sales metrics you want to track
Before creating a sales dashboard, determine what sales indicators you wish to track.
Start by asking yourself questions like ‘What are the key performance indicators?’, ‘Which metrics are regularly reviewed by the company during performance meetings?’, and ‘Are some metrics considered more important than the others?’
These are some of the questions that can help you decide what to expect from a sales dashboard, and accordingly, create one for your team.
#2. Choose a sales dashboard platform
Once you have determined what type of sales dashboard you want, it is time to choose a sales dashboard provider.
If your company already uses a CRM tool, it is highly likely that it includes a sales dashboard as well.
However, if not, you can choose from a range of standalone sales reporting platforms that can help you either import or sync data to generate sales reports and metrics.
15 Sales Prospecting Tools For a Tight Budget
#3. Identify how the dashboard will be used
Since there is no one-size-fits-all dashboard, it is important to know how the dashboard will be used.
To identify why you need a sales dashboard, start by asking questions such as who will be using the dashboard, how they will use it, whether the sales performance will be reviewed daily, weekly, or monthly, and what metrics or graphs will be used to assess performance.
You should also consider where the sales dashboard will be viewed – on a desktop, tablet, or smartphone.

#4. Keep it simple
While it may be tempting to include every metric and visual on your sales dashboard, it is better to keep it simple.
No one likes a dashboard that consists of all the metrics and graphs but is difficult to understand and decipher.
Hence, only include those parameters that are relevant to analyzing and tracking sales performance.
#5. Create reports for the sales dashboard
When it comes to generating sales reports, you can choose from a wide range of charts for data visualization.
Depending upon the data you are planning to use for reporting, you can either use line graphs, scatter plots, or bar graphs for comparing numbers, pie charts or area charts for breaking down the components of your sales, and line charts or column charts to track progress over a given period of time.
Ace the Sales Process: 9 Simple Strategies Nobody Ever Follows
Wrap Up
Employee performance management is critical to an organization’s success. Dashboards can help you visualize and analyze the overall sales performance of your organization.
They can help you detect and address problems before they spiral out of control and affect your bottom line. Sales dashboards can also help you communicate better with your employees so they can make better decisions and reach their goals.
If you want a super affordable CRM tool that can help you generate sales dashboards for various common and custom metrics, try EngageBay.