
The brand-customer relationship is one of the most important aspects for any business. It is more than just about the money; it is about the real relationship between a team of professionals and the customers. Although fairly difficult to measure, it holds great value.
Customer engagement metrics can help put some degree of tangibility on the relationships between a brand and its customers.
One of the best benchmarks of a brand doing well is the extent of customer engagement. In this article, we share the top customer engagement metrics you should know and how you can create them.
Table of Contents
The Top 10 Customer Engagement Metrics and How to Use Them
Hold on, here are some stats:
- 84% of customers have stated that the experience a brand provides them with is equally important to the product or service.
- Brands that have successfully engaged their B2B customers have a 63% lower customer attrition.
- A customized and tailored engagement based on past interactions is preferred by 64% of customers.
So, without further ado, let us take a closer look at key customer engagement metrics.
#1. The Net Promoter Score (NPS)
The net promoter score determines how likely a customer is to recommend your product or service to their friends and family. It is an approach to gauge customer loyalty in relation to your service and to understand how well your product or service is doing in terms of customer engagement.
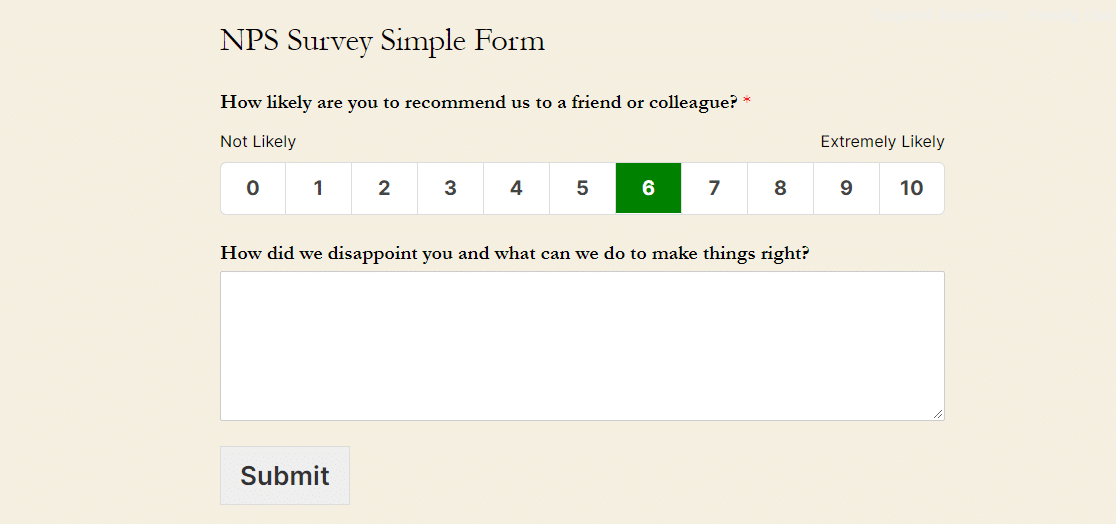
A typical NPS consists of a survey of impactful questions such as asking a customer to rate their experience with a numerical value or an open-ended question such as “how likely is it that you would recommend our brand to your friends and family”.
If the NPS scores are not satisfactory, prepare a follow-up question to understand why the customer is not satisfied. This would give you valuable insight into how to improve your service.
To analyze your NPS score to that of industry-standard use an NPS benchmark calculator.
The usual scale factor is as follows:
- 0-6- Detractors
- 7-8-Passives
- 9-10-Promoters
Promoters are those set of clients who are most likely to recommend your product to others. Detractors are the ones with negative reactions and passives stand neutral.
Based on the survey response you can calculate the NPS percentage with this formula:
NPS = Promoter% – Detractor%
For instance, a 70% promoter (Positive) score with a 20% detractor score (Negative) will result in an NPS of 50.
Here is a sample NPS template to give you an idea:
#2. Customer Satisfaction Score (CSAT)
Similar to NPS, a Customer satisfaction score is based on satisfaction with the experience they have with your brand. NPS measures loyalty.
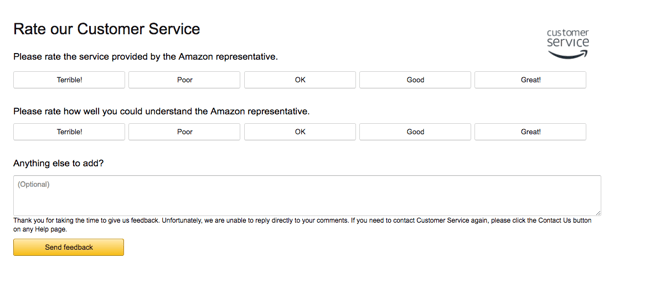
The CSAT is a transactional metric and is based on a survey. A typical CSAT survey should consist of two or more questions based on how the product or service is received by the customer and a follow-up question to gain insight on how to better the product or service to match the client’s expectations.
One of the benefits of using CSAT is to measure customer satisfaction explicitly with a specific feature of a product or with interaction such as with a customer service agent.
A simple feedback form can help analyze customer satisfaction with a service promptly like the example below:
Read also: Read also: Multichannel Retailing: Everything You Need to Know
#3. Customer Lifetime Value (CLV)
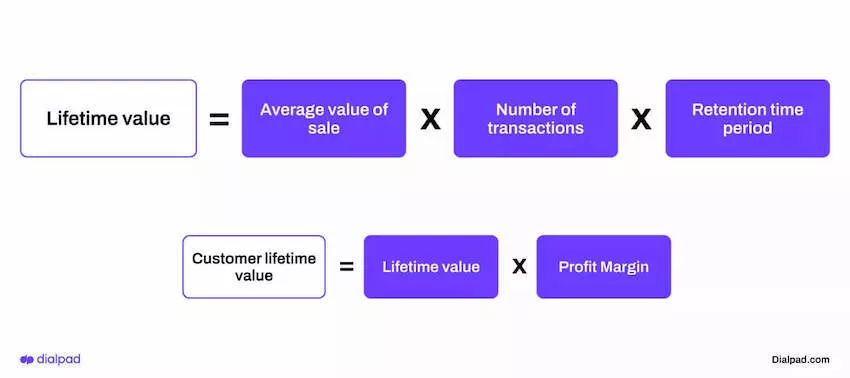
Customer lifetime value is a long-term assessment. CLV is calculated on the overall monetary contribution of a customer during their lifetime.
The longer a customer remains with you the higher the CLV, meaning the higher the money they will spend on you. Here is the formula that will help figure out your CLV when compared to lifetime assessment:
While acquiring new customers is important, it is equally important (and cost-effective) to retain old, loyal ones. CLV is an important factor that comes into play in this matter. The higher the CLV the more the profit.
Your goal should be to work on the CLV score and prioritize improving the experience for loyal customers.
Read also: Customer Lifecycle Management (How to) Guide for Business Owners
#4. Churn Rate or Attrition Rate
The churn or attrition rate is the measure of customers lost during the company’s lifetime. It is an important metric to understand why people are leaving your business and what is the best way to prevent them from leaving.
Churn is especially important for SaaS businesses and any company that runs on a subscription basis.
It goes without saying, the lower the churn rate, the better. A lower churn rate also amounts to more loyal customers.
Here is the typical formula to calculate the churn rate:
Churn Rate = The number of clients at the beginning of a period [minus] the number of clients at the end of the period [divided by] the number of clients at the beginning of a period [multiplied by] 100.
Here is a graphical representation of a churn rate calculation:

Read also: 6 Steps to Win at Your CRM Strategy
#5.User Activity and ‘Stickiness’
These are two different metrics, and both are important to measure. Let’s see what they mean.
User Activity
User activity determines how many users visit your business on a monthly or daily basis. They can be divided into two:
- DAU or daily active users
- MAU or monthly active users
DAU and MAU are good ways to measure how customers engage with your service and how often they do so. These customer trends can provide insight into improving your business.
A good practice with user activity is to monitor why a new customer is seeking your business. By understanding this you will be able to promote your brand in a better way.
Stickiness
Have you ever liked a cafe so much that it is your go-to place? For the cafe, you are a “sticky” customer and that is a great thing!
Stickiness is a measure of customers’ “stick” with your brand. The more loyal the customers the more likely they are to stick with your brand throughout their lifetime, indicating higher customer satisfaction.
Stickiness is measured with the help of DAU and MAU mentioned in the above section with the following formula:
Stickiness = DAU divided by MAU
While this metric is a great way to measure customer satisfaction, it would be advisable to combine it with other metrics to get the best results.
Read also: Relationship Marketing Definition and 10 Proven Strategies for Customer Happiness
#6. Bounce Rate
Bounce rate is a measure of the number of visitors on your website who exit viewing only one page, typically the landing page.
The bounce rate is inversely proportional to the success of a business. The lower the bounce rate the more successful your business would be. It is also an important indicator of how well a typical customer is engaging or not engaging with the site.
There are many reasons for a high bounce rate including bad website design/ user interface, unappealing content, or just a general disinterest.
In order to maintain a low bounce rate, it is important to post high-quality content and focus on stellar customer experience rather than just promoting your business.
Read also: The Extraordinary Power of Customer Needs & How to Solve Them
#7. Page Visit Frequency and Session Time
Measuring visit frequency and average session time can be a little complex. Visit frequency measures the number of visits to your website. Now, you need to fix the ideal number before you proceed to measure. Some services may require a daily visit while some others might be more of a seasonal thing.
The ideal method to measure visit frequency is to quantify how many customers are visiting your page and how much time is present by an average customer on your page.
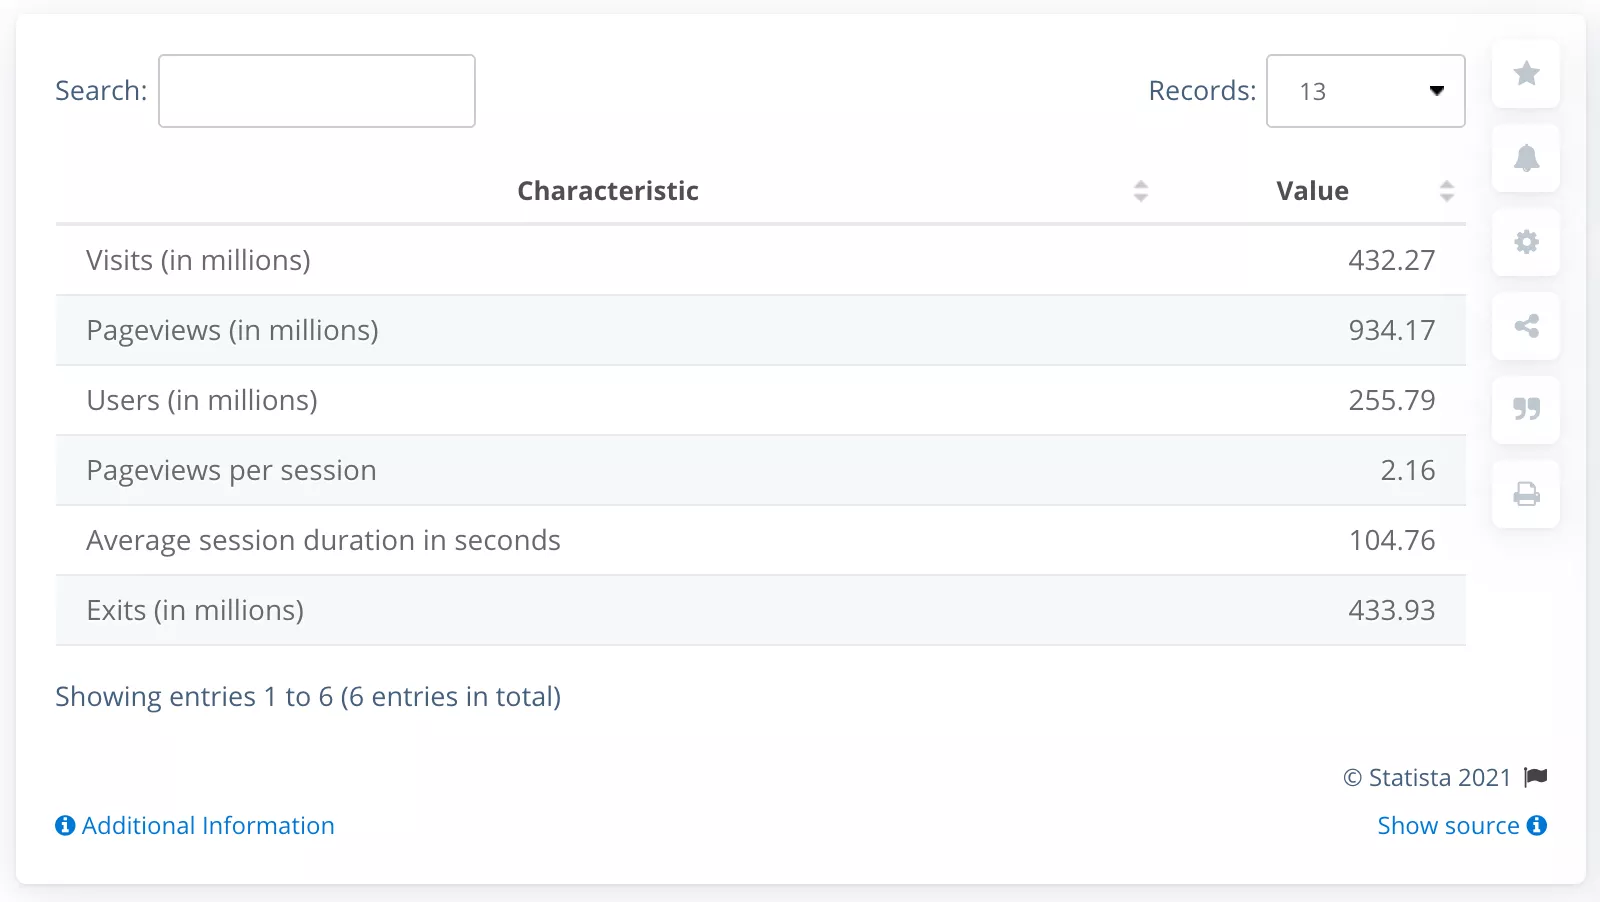
Session time is the measure of the time spent by customers engaging with your website or app. Google Analytics provides a good tool to measure which pages are the most visited and which pages customers spent the most time on.
This is an effective insight that can help in perfecting your marketing campaign.
A shorter session time may not necessarily be a bad thing. This could mean a customer found what they are looking for quickly and thus proceeded to exit.
Similarly, a long session time may not always be a good indicator. It could indicate the customer has been searching for what they came for and hasn’t found it.
Read also: 15 Great Sales Page Examples (And Why They Convert)
#8. Conversion Rate
Conversion rate is based on the action a customer takes prompted by your marketing campaign. These could include but are not limited to:
- Downloading an e-book or white paper
- A signup
- Clicking on Facebook ads
- Subscribing for a free product trial
Conversion rates are quite simple to calculate:
Conversation Rate = Total number of conversions [divided by] the number of visitors [multiplied by] 100.
This metric is of significant value for a brand as it is a direct observation of how well your marketing campaign is doing and how well it is received by the audience.
Read also: 6 Handy App Engagement Metrics To Track Today
#9. Social Media Engagement
Social media is the main channel for customer interaction with a brand. A brand’s value can be determined by the way customers react to its marketing efforts on social media.
Each social media channel provides different metrics to analyze and use. This could range from likes to mentions to interaction on a post or a story( Instagram).
Some tools such as Google Analytics, and Instagram/Facebook insights can help provide valuable insight on customer engagement on each post. The insights (both positive and negative) gained from these metrics can be used to fine-tune your marketing efforts to better reach the audience.
Social media management tools also come in handy and having an in-house social media team to monitor and calibrate your marketing efforts would be the ideal scenario.
#10. Customer Acquisition Cost (CAC)
Last but definitely not the last. Though not directly involved in customer engagement, customer acquisition cost is an important factor in determining a quantifiable measure of customer satisfaction and is an important metric to investors and companies.
CAC is the amount spent on acquiring customers such as the money spent on marketing efforts, operational costs, etc divided by the number of new customers acquired through these endeavors.
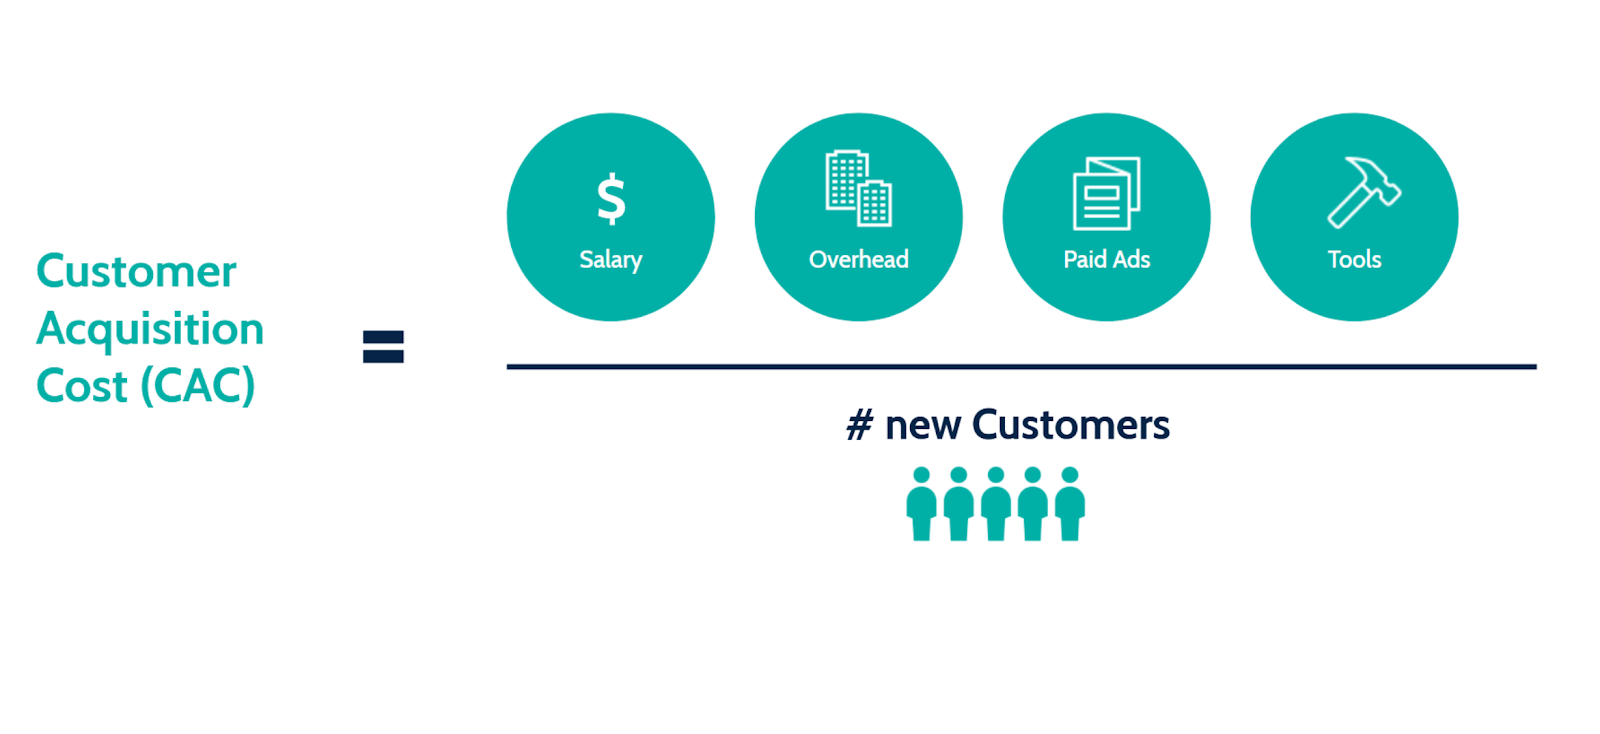
Say for instance a company spent $5,000 annually on marketing and acquired 5,000 new customers within a stipulated time frame, the CAC would be $1, which is nominal. If this seems too expensive, it is indicative of revamping your marketing efforts and reevaluating customer satisfaction.
Read also: 15 Marketing Metrics To Grow a Small Business
Parting Words
The client relationship is the most important bond that forms the core of a successful business. Loyal customers are not easy to gain and the relationship is built gradually with a lot of effort from the brand.
Once you have reached a satisfactory level, it is important to measure customer engagement metrics to understand how well your brand is doing and how to improve your efforts. The metrics covered in this article can work wonders for a brand if combined and used appropriately.
We hope this blog post is insightful.
Do let us know which metric proved to be the handiest 😁!
Want to know how EngageBay can help you build your success story? Sign up with EngageBay to get a free demo.
 Strengthen your customer relationships with our top management strategies – explore our comprehensive guide now!