Would you take decisions for your eCommerce store based on mere gut instinct and anecdotal evidence? Or would you prefer to make data-driven decisions that understand the pulse of your target audience?
You’d prefer the second option, right?
This is precisely why eCommerce analytics is so important for eCommerce owners and marketers.

If you want a clearer snapshot of what drives your sales, which channels are effective, and make intelligent decisions for your business, then this article is for you.
By spending the next few minutes on this article, you’ll get a good idea of:
- The definition of eCommerce analytics
- The benefits of monitoring eCommerce KPIs
- The top 16 eCommerce KPIs
- How to track your KPIs
- The four steps to set up Google Analytics
- The significance of customer behavior for eCommerce stores
- The top 5 Paid & Free eCommerce analytics tools (with pricing plans)
Ready to dive in?
Table of Contents
What is eCommerce Analytics?
eCommerce analytics is the process of gathering data about the performance of your online store from all sources to understand customer behavior better and use this data to drive more sales.
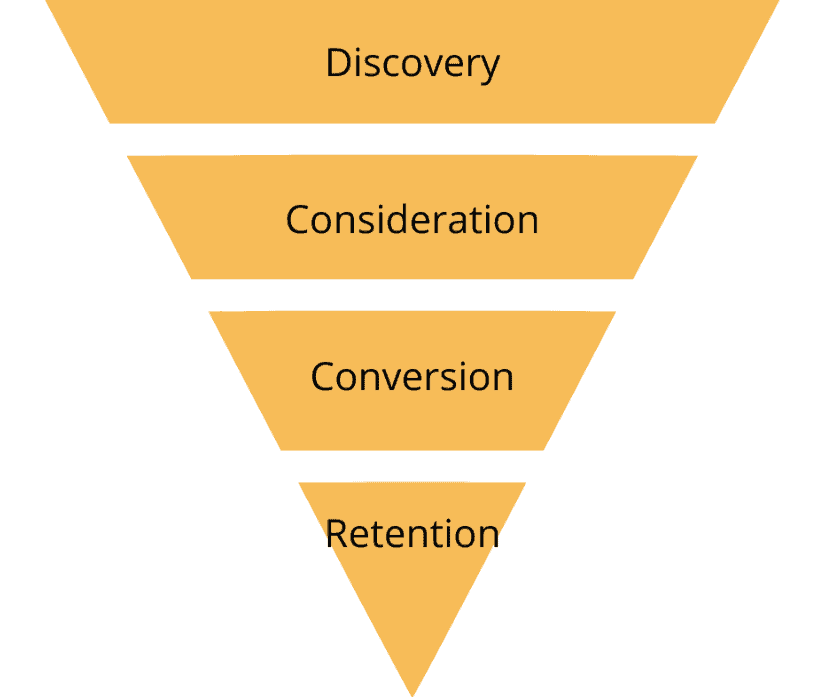
eCommerce analytics draw on data from all stages of the customer journey, from the awareness or discovery stage to the advocacy stage.
Whether it’s KPIs like your organic website traffic or the effectiveness of your latest referral campaign — these metrics become the building blocks of your eCommerce analytics.
That makes sense, right?
So, your eCommerce metrics and KPIs are raw data points. Then, you’ll use these data points to analyze and interpret these data points to make better decisions. Here’s how your team can use analytics to improve your marketing and sales campaigns.
Here’s an easy way to remember the difference between a metric and analytics. Think of your metrics as individual Lego blocks. Then, you’ll use put these blocks together to create something a new structure like a building.
In the same way, all your metrics are used in building your overall marketing and sales strategies. The individual data points become the raw material from which eCommerce analytics is built.
Read also: eCommerce Metrics Made Easy: How to Drive Growth
Benefits of Monitoring eCommerce KPIs
Now that we’ve given you a breakdown of the definition, you may be wondering how it benefits eCommerce and DTC companies.
Here’s why your company needs to make the most of eCommerce analytics:
- Improve customer experience and retention: By measuring the right KPIs, you’ll understand customer pain points and overall customer satisfaction levels. A recent study showed that 47% of customers would pay more for a better online shopping experience. By measuring the retention rate, you’ll be able to find strategies to improve customer loyalty too.
- Improve segmentation, targeting, and retargeting: You’ll be able to send personalized messages, offers, and product recommendations based on customer behavior. And, you’ll be able to launch retargeting campaigns for prospects who are aware of your brand but haven’t yet become paying customers.
- Increased marketing ROI: You’ll be able to track exactly where every dollar invested in your marketing campaigns is going. And, you’ll be able to make quick changes to your marketing strategy based on live data to improve your marketing ROI over time.
- Gain a competitive edge: When your team does an excellent job with analytics, then you’re more likely to make better decisions to drive sales. No matter the state of the economy, you’ll gain a competitive advantage in your product niche.
- Optimize your sales and marketing funnels: You’ll be able to make the right tweaks to keep your marketing and sales funnels up-to-date and optimized. Funnel performance analysis is a key part you can’t miss.
- Identify and leverage top-performing marketing channels: By monitoring data regularly, you’ll get a clear idea of which marketing channels should be used and when. It helps streamline your marketing strategies.
Read also: 7 Powerful eCommerce Marketing Automation Strategies + Tools
16 KPIs for Thriving at eCommerce Analytics
So, that’s how analytics can help your eCommerce business. Pretty cool, isn’t it?
But, what are the most important eCommerce KPIs? Or, which building blocks should you focus on to get the right marketing structure?
So, we have put together a list of 16 eCommerce KPIs for each stage of the customer journey. Let’s begin with the first stage.
4 Crucial KPIs for the Awareness Stage
Here are the top KPIs to measure in the discovery or awareness stage of the customer journey.
1. Organic and paid website traffic
The first KPI you’ll need to track for this stage is the total number of organic, inbound traffic to your website.
This KPI is important if you rely on your blogs and SEO to build brand awareness. Organic traffic is a measure of how many prospects found your website through search engines.
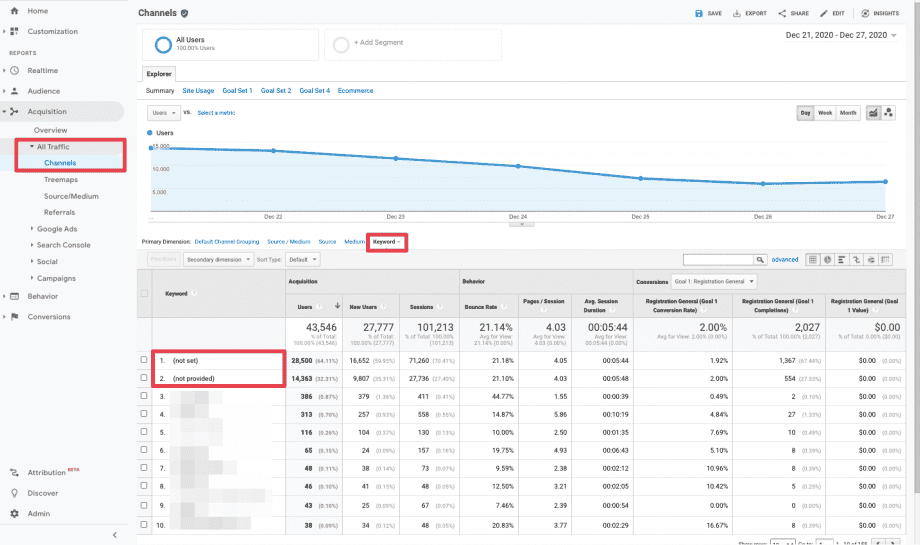
Similarly, measuring your paid website traffic will let you measure the success of your targeted ads. You can get both of these KPIs from Google Analytics.
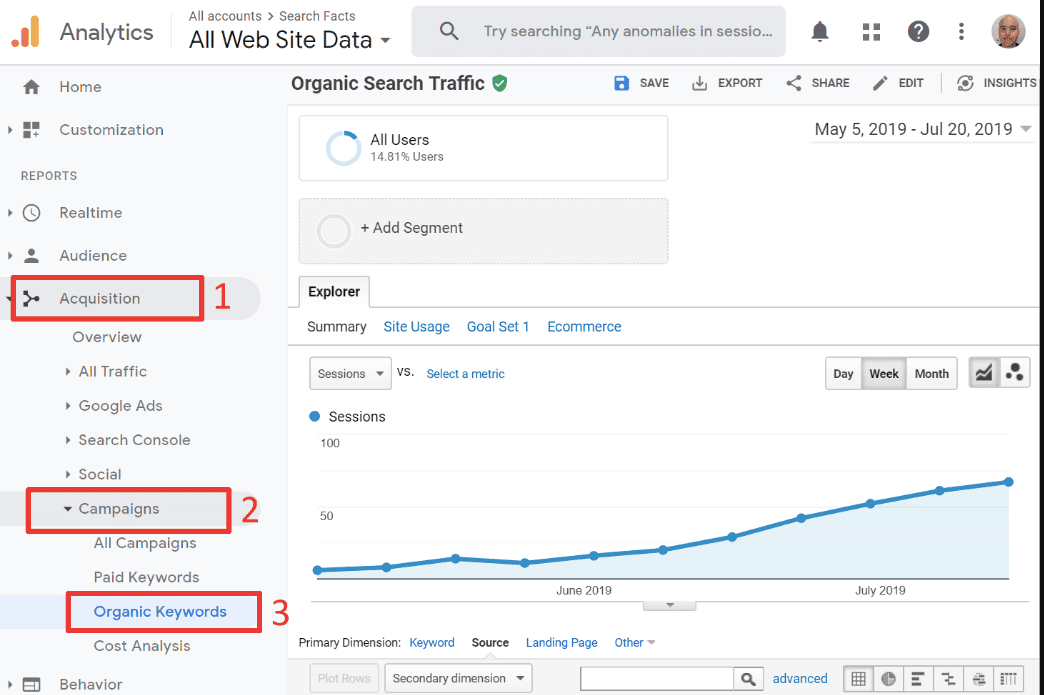
In Google Analytics, you can track organic traffic based on source, location, landing pages, and more.
Read also: Predictive Analytics for eCommerce Emails: Beginner’s Guide
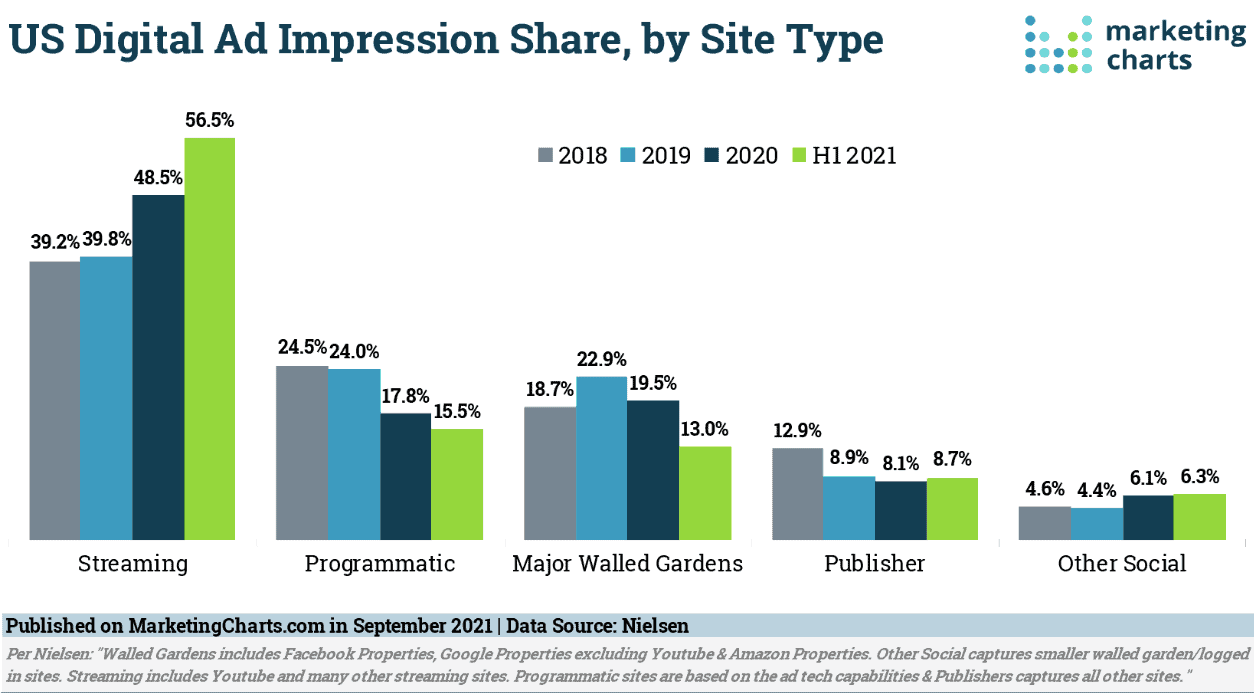
2. Ad impressions (IMPR)
Ad impressions refer to the number of times a particular ad was displayed to prospects in your network.
So, each time your ad shows up on a prospect’s device, it is counted as one impression. We’ll need to deduct duplicate impressions before calculating the IMPR.
3. SEO keyword rankings
Google officially defines keywords as “words or phrases describing your products or services that you choose to determine when and where your ad can appear.”
Having the right keywords at the right frequency can help your content rank higher on SERPs (Search Engine Results Pages). You’ll need to target the relevant keywords and analyze your competitor’s keywords that rank high.
The higher your rankings, the higher your visibility. This means more revenue is generated in the long run.
4. Cost Per 1,000 Impressions (CPM)
CPM refers to the amount you have spent for every 1,000 impressions on your webpage. Usually, we measure the CPM for each webpage.
When calculating your CPM, there’s an important caveat. You’ll need checks and measures to avoid counting duplicate views or internet bots. There are several reliable online CPM calculators. You can find one here at WebFX or Omni Calculator
Read also: How To Optimize Your CTR With eCommerce Email Heatmap Analysis
3 KPIs for the Consideration Stage
Here are four important KPIs for the consideration stage of the buyer journey.
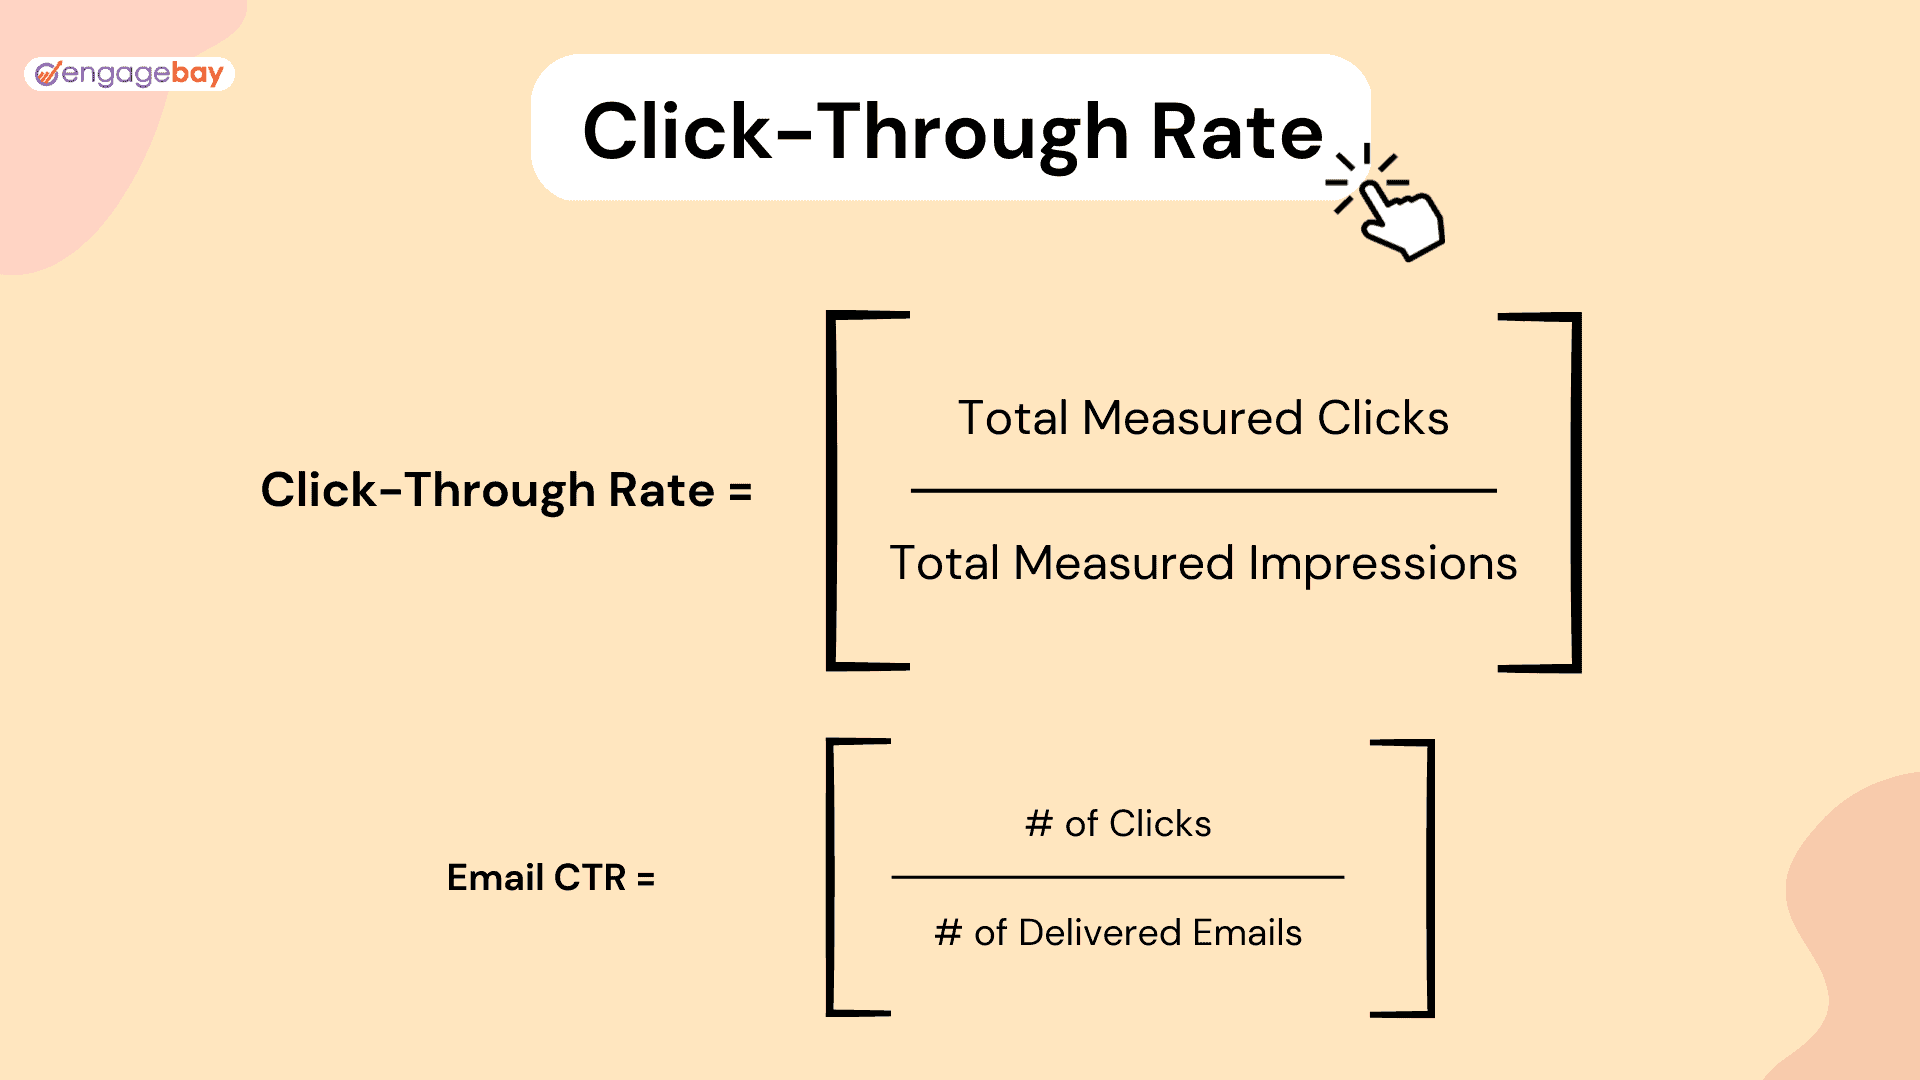
1. Click-through Rate
Ideally, you’ll calculate the click-through rate for landing pages, targeted ads, and email marketing.
The average click-through rate is the percentage of people who clicked and viewed your link, email, or post. It measures the ratio of clicks to the total number of impressions on the landing page or email.
The click-through rate is a snapshot of the overall effectiveness of your marketing campaigns. Here’s the formula.
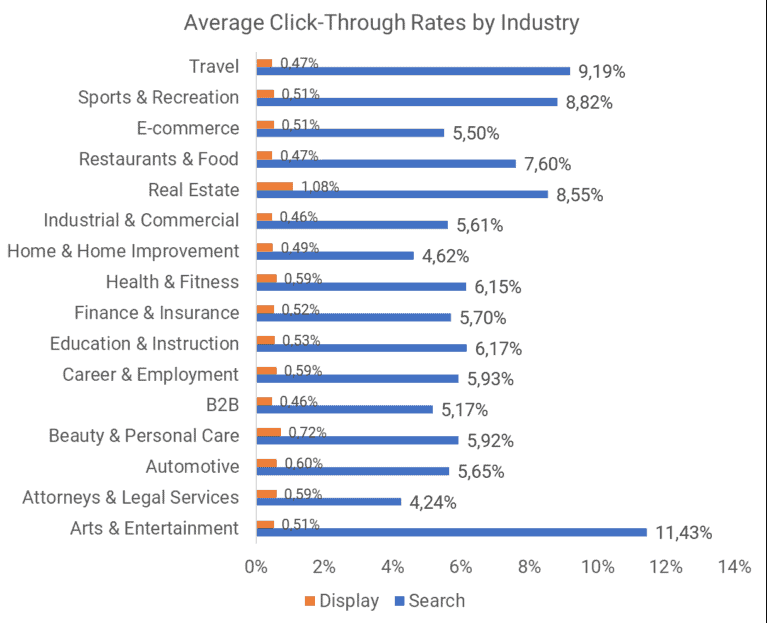
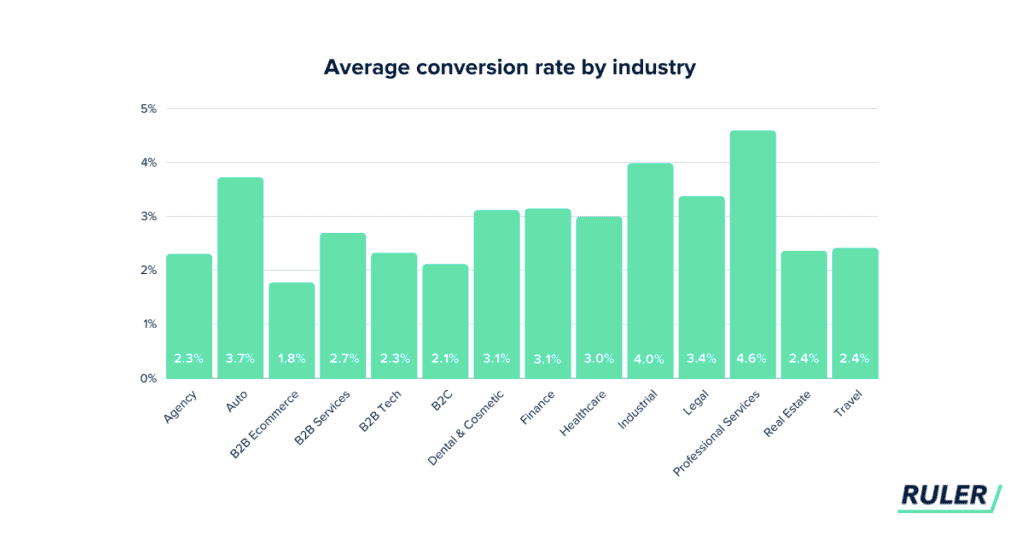
Click-through rates vary by industry and the type of ad or social media channel. Here’s a snapshot of average click-through rates across industries for display and search ads.
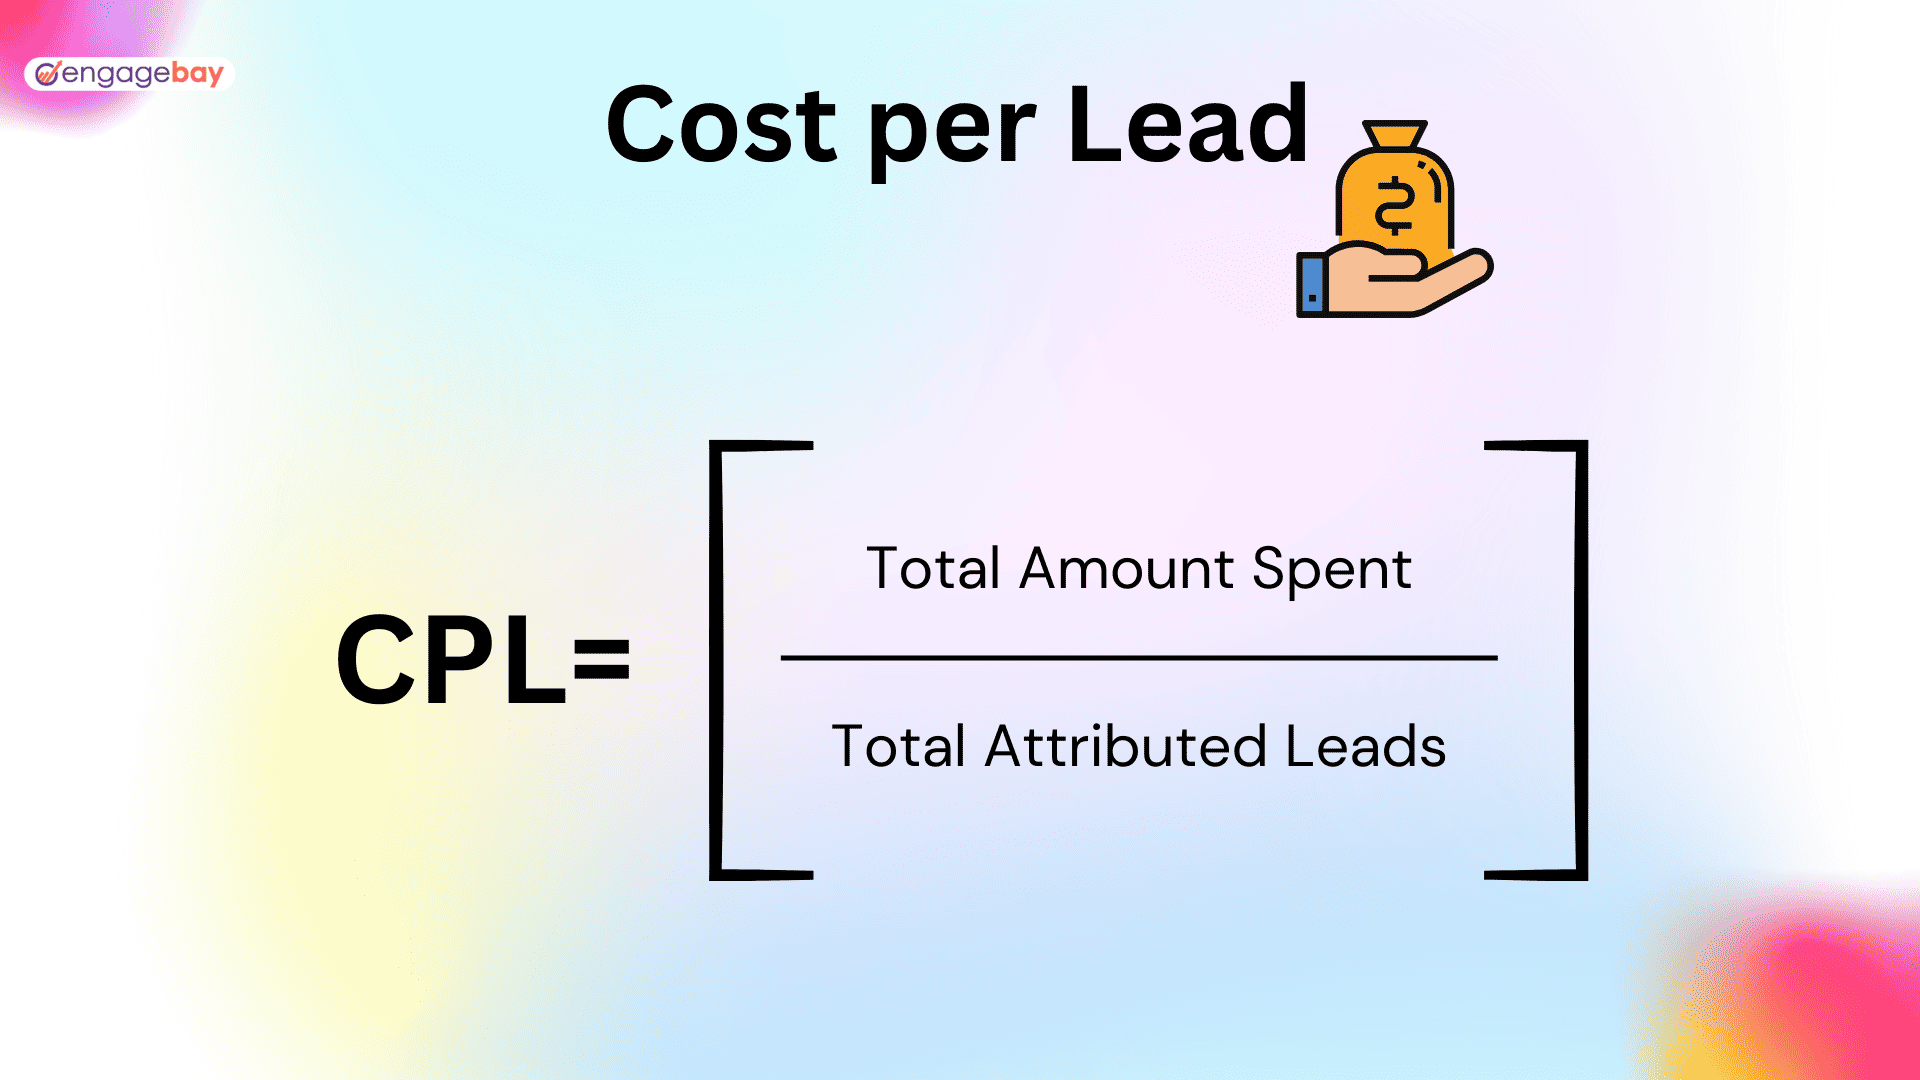
2. Cost Per Lead
The cost per lead is the amount of money spent on ads and marketing campaigns to generate a new lead. CPL is a crucial component of the cost-per-lead ad pricing model.
How does this work?
In this model, your business pays a third-party website to run ads. When a prospect clicks on your ad, they’ll be redirected to a landing page or a product page.
You can get prospects to sign-up using a lead magnet, a newsletter subscription, or buying a discounted product. When they join your contact list, the third-part also receives a commission. Here’s the average CPL across industries.
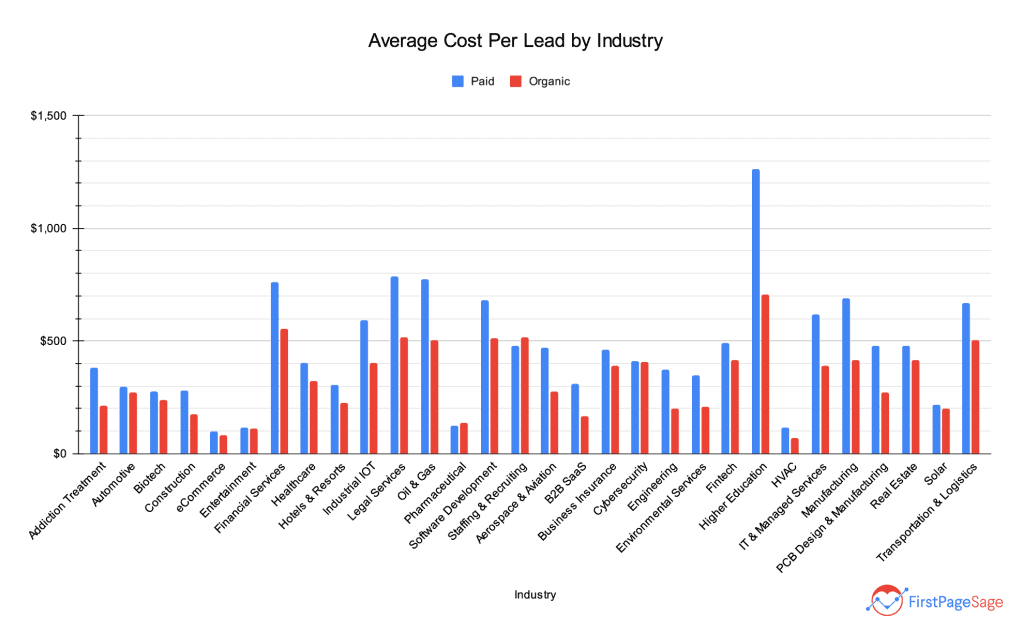
You should also calculate CPL on your organic leads. The CPL is an important KPI that lets you determine which channels generate the most leads.
You can then assign your marketing budget to the right channel to generate even more leads. Here’s how you can calculate your CPL.
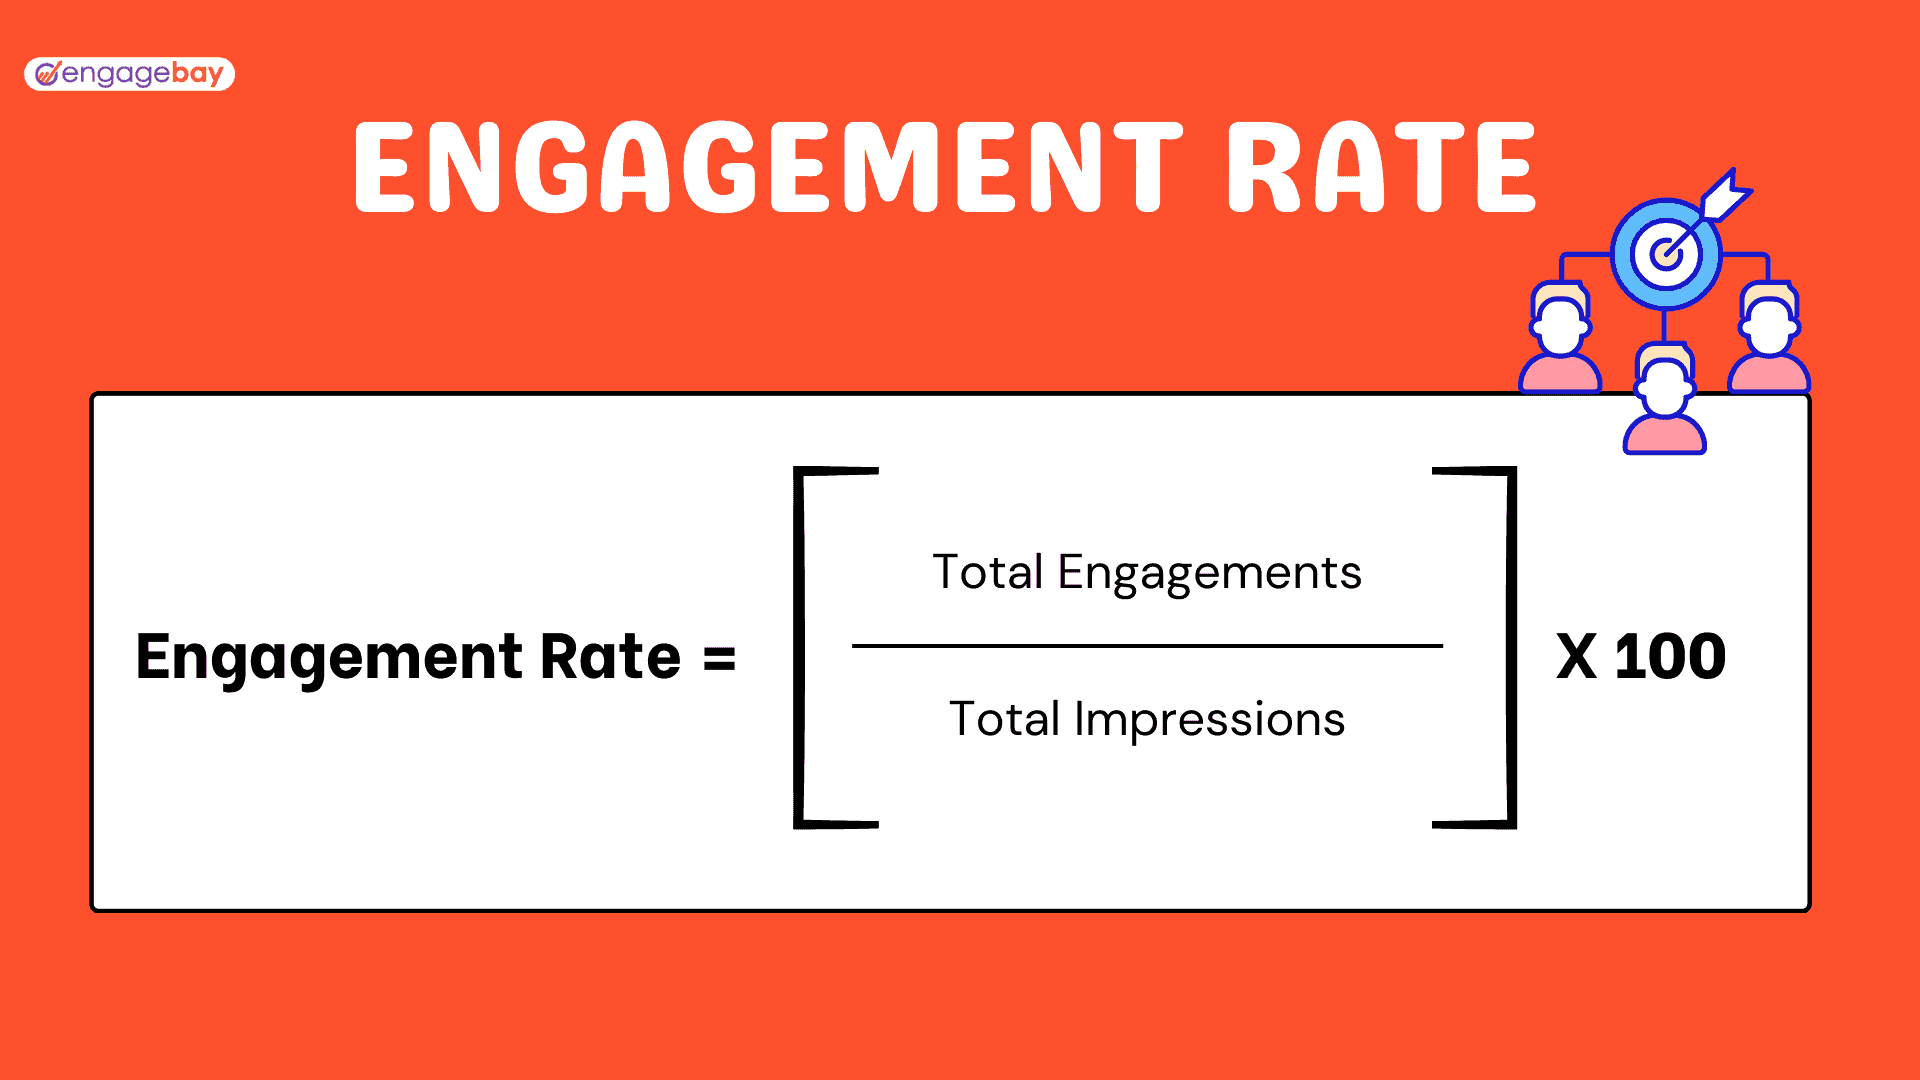
3. Engagement Rate
The engagement rate is a way of measuring the rate and level of interaction by prospects with your social media content or web pages.
Google Analytics 4 replaced bounce rates with engagement rates to be more action-oriented. For web pages on Google Analytics, an “engaged” session meets at least one of the below requirements:
- Lasts more than 10 seconds
- Contains one or more page view
- One or more conversion event
Here’s how to calculate the engagement rate. Alternatively, you can use online engagement rate calculators for your social media engagement rates.
Read also: Bold eCommerce Advertising Strategies for Growth
4 KPIs for the Conversion Stage
There are three top KPIs you can’t miss in the conversion stage of the customer journey.
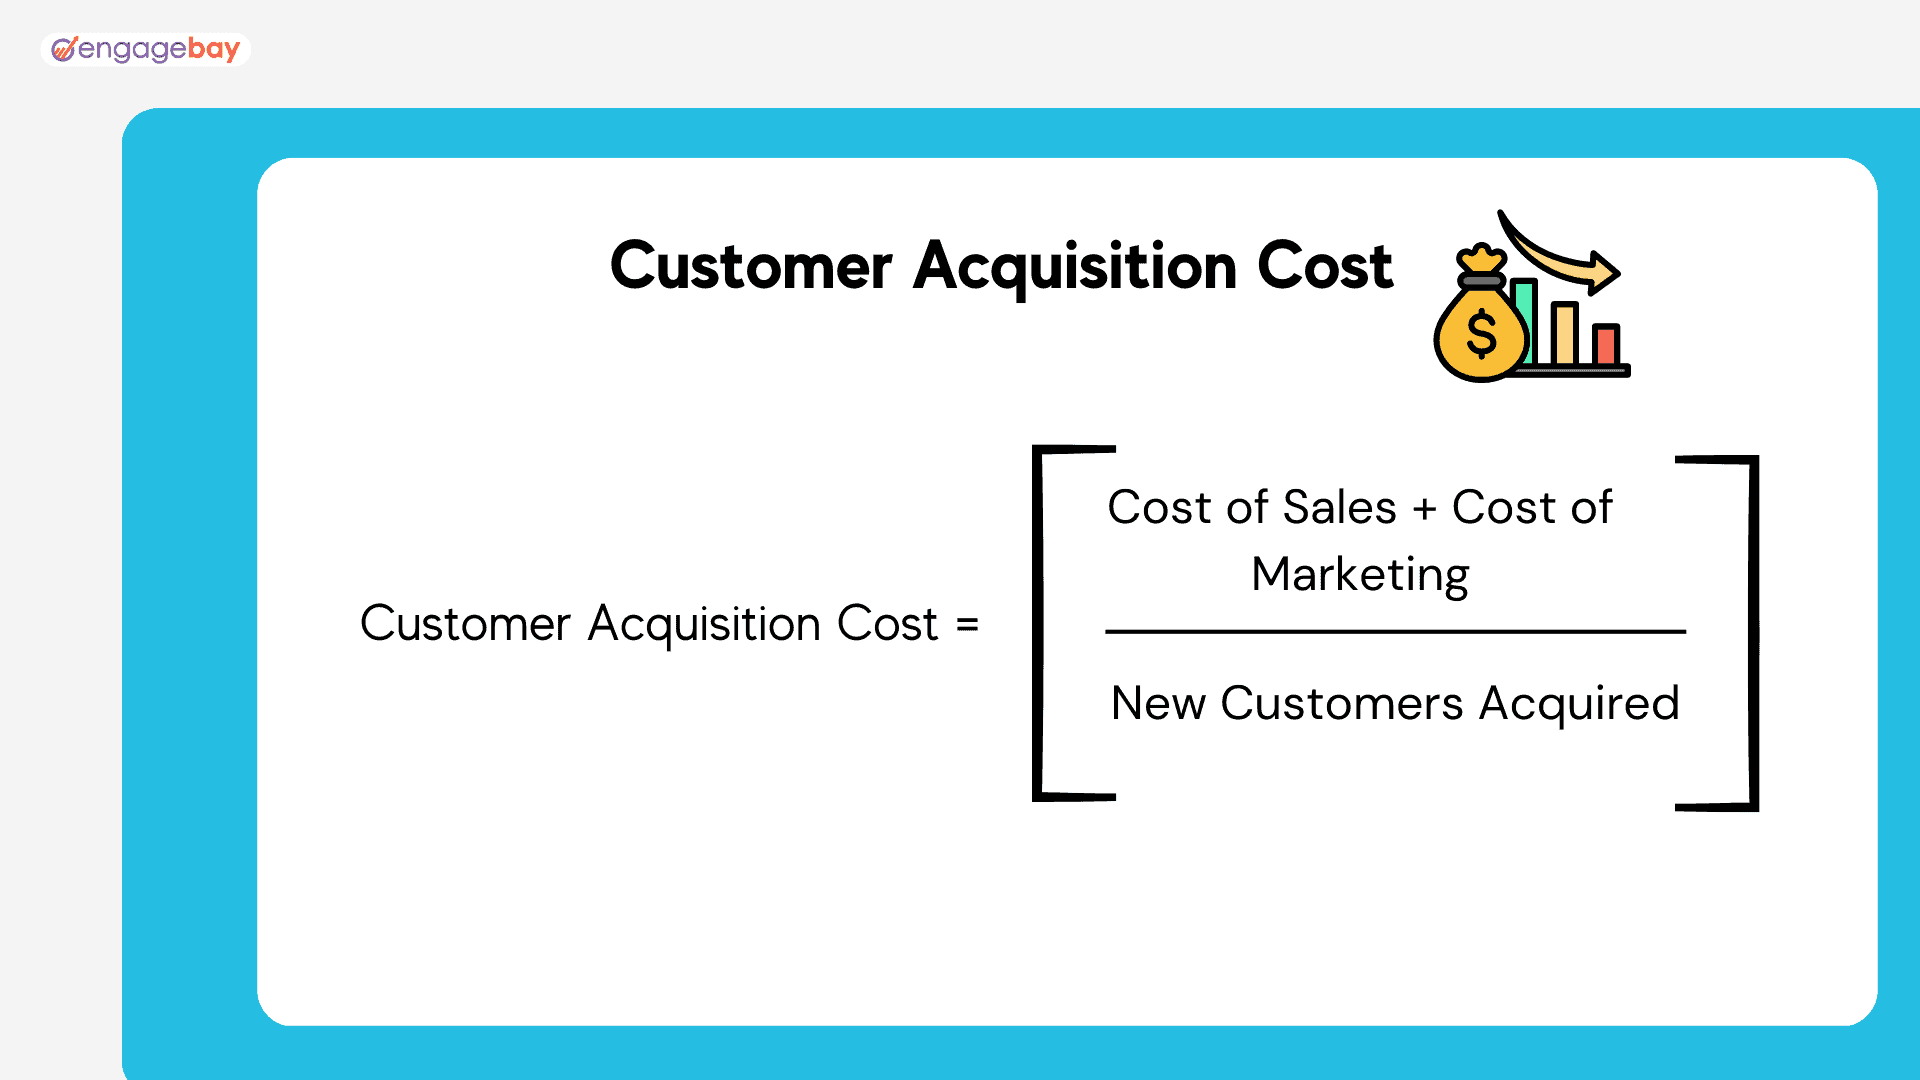
1. Customer Acquisition Cost (CAC)
The customer acquisition cost (CAC) measures the amount spent in sales and marketing to gain one new customer for a particular period.
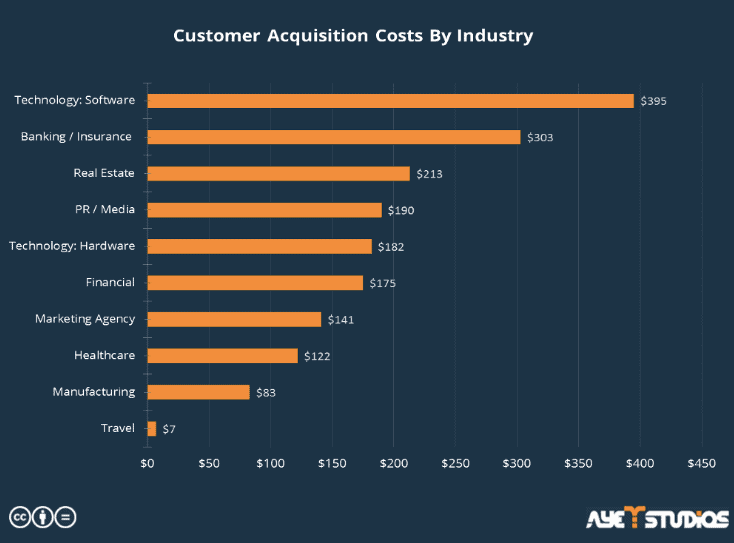
Companies are facing significant challenges in reducing their customer acquisition costs due to stricter data privacy laws and the end of third-party cookies by 2024.
You can use this easy formula. But, remember to add overhead and additional costs when you calculate it.
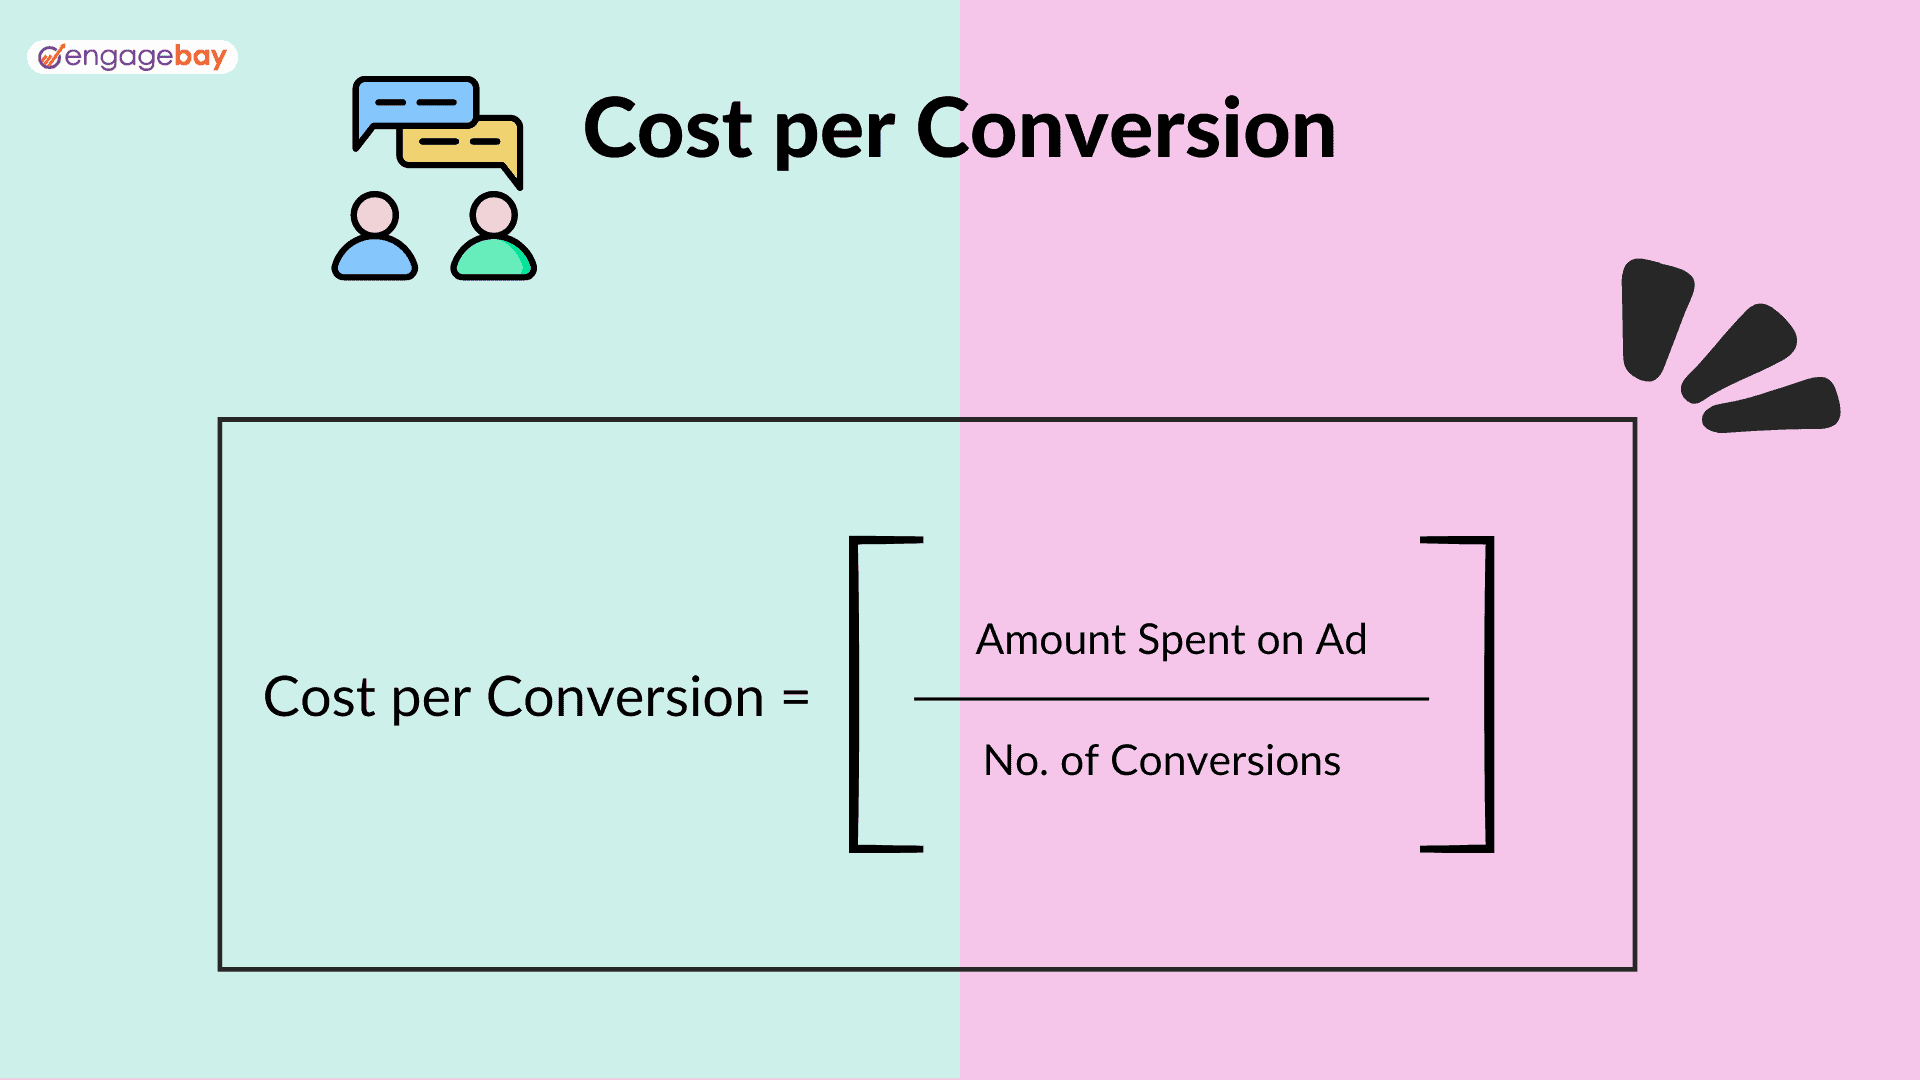
2. Cost per Conversion (CPC)
The cost per conversion(CPC) measures the amount spent on ads to acquire a new customer.
What’s the ultimate goal of each ad campaign? To get more customers, right? This metric measures the success of this goal against the number of dollars you’ve invested in it.
You can segment your CPC by marketing channels like social media, content, targeted ads, and email. Here are the industry standards.
This particular metric will also come in handy for marketing channel analysis. This is because you’ll get a snapshot of how each marketing channel resulted in conversions. Here’s the formula.
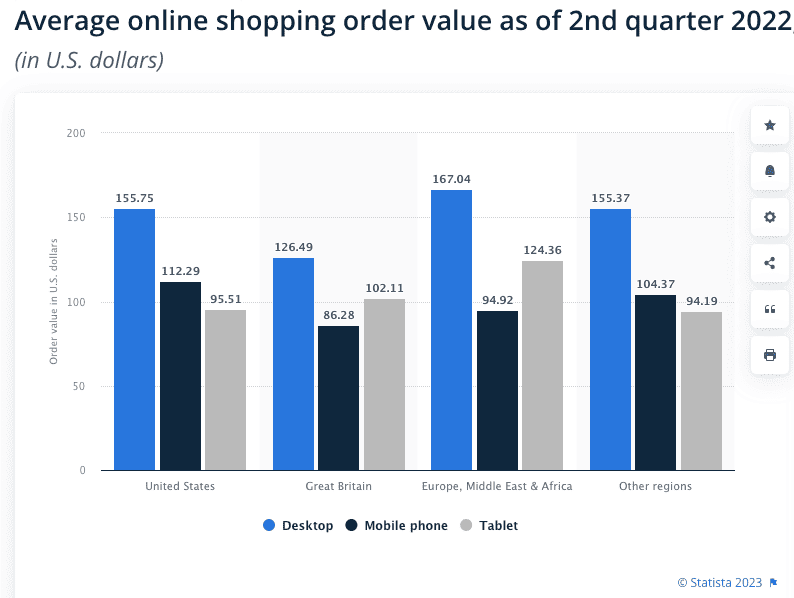
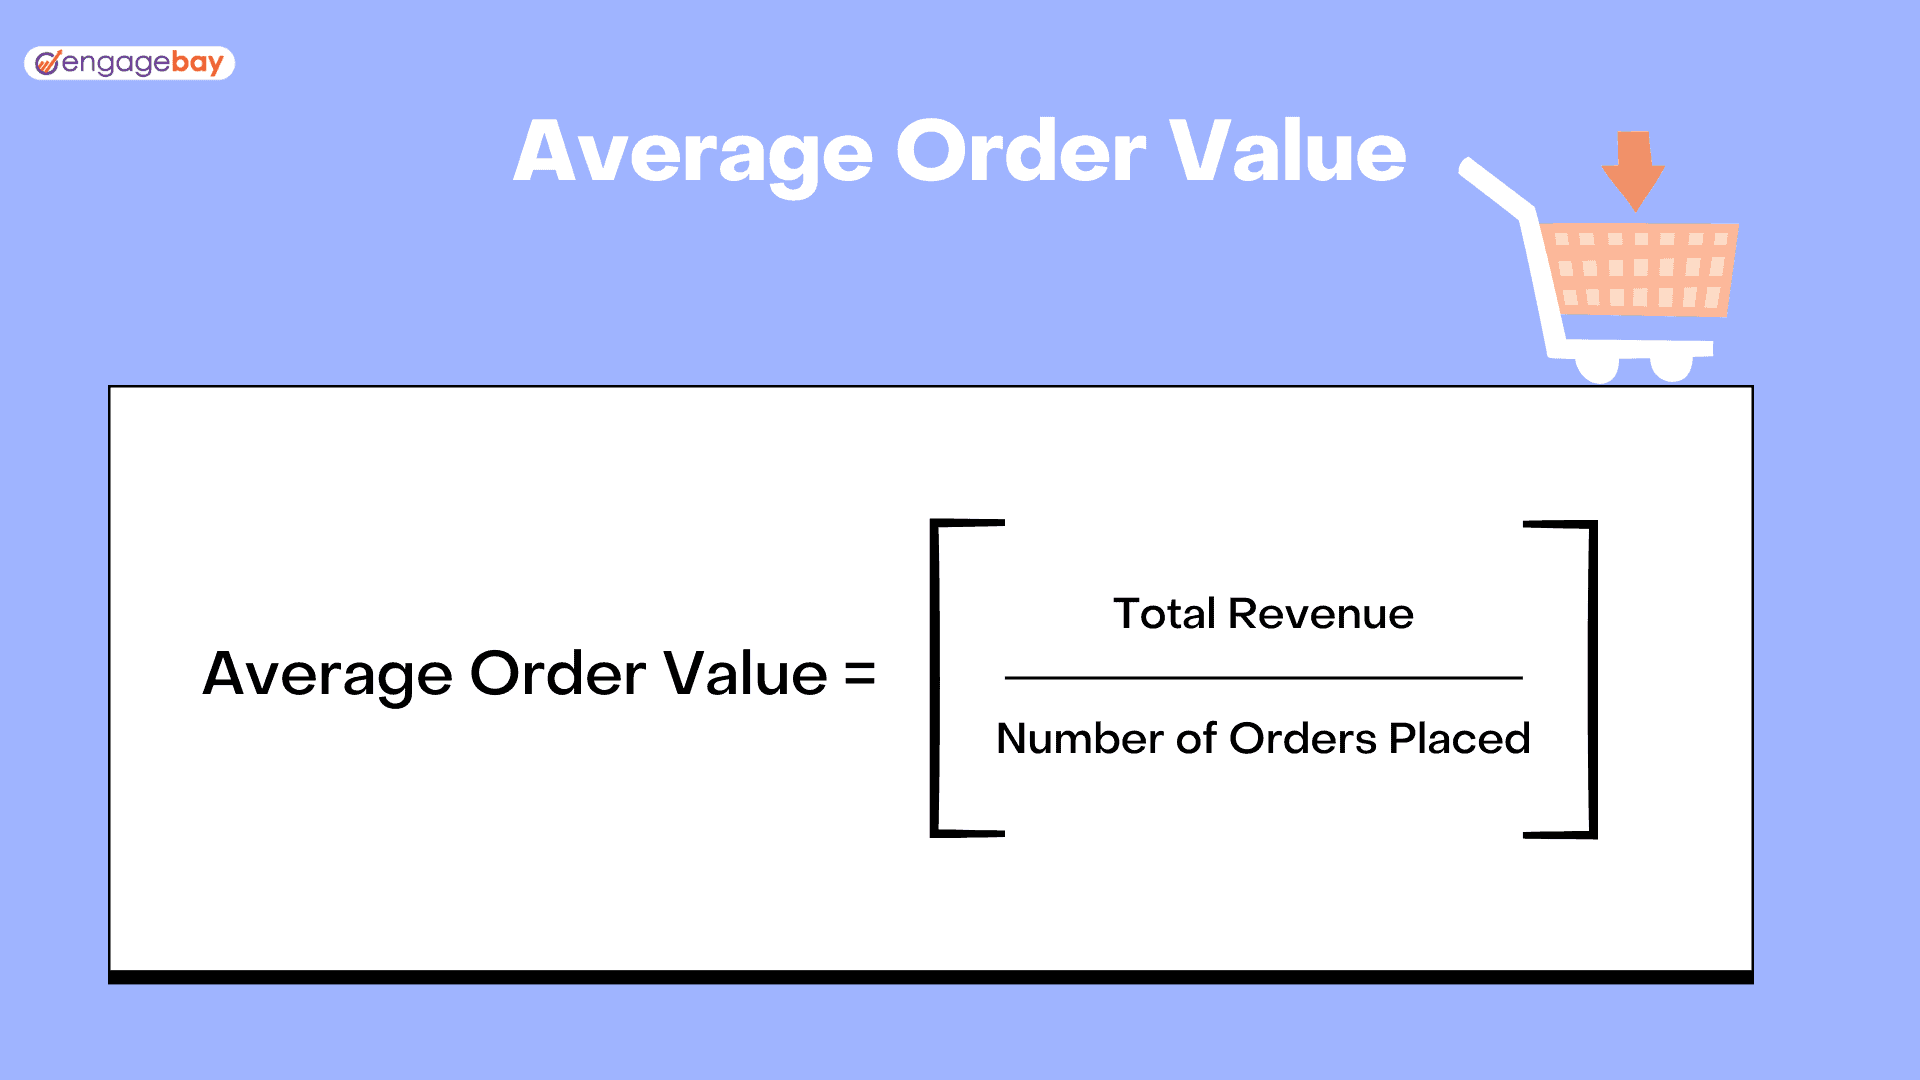
3. Average Order Value (AOV)
The average order value (AOV) calculates the average money spent by a customer when they place an order at your store or for your services. This metric is also known as the Average Market Basket.
A high average order value rate means more percentage of each sale goes towards your profit. Over time, you’ll be able to sell more products at a less price without affecting your profit margin.
Upselling and cross-selling techniques can help boost rate your average order value. Calculate your AOV using this formula.
4. Cart Abandonment Rate
The cart abandonment rate measures the percentage of customers who added items to their cart and abandoned it before completing the purchase. Apply this formula to calculate.
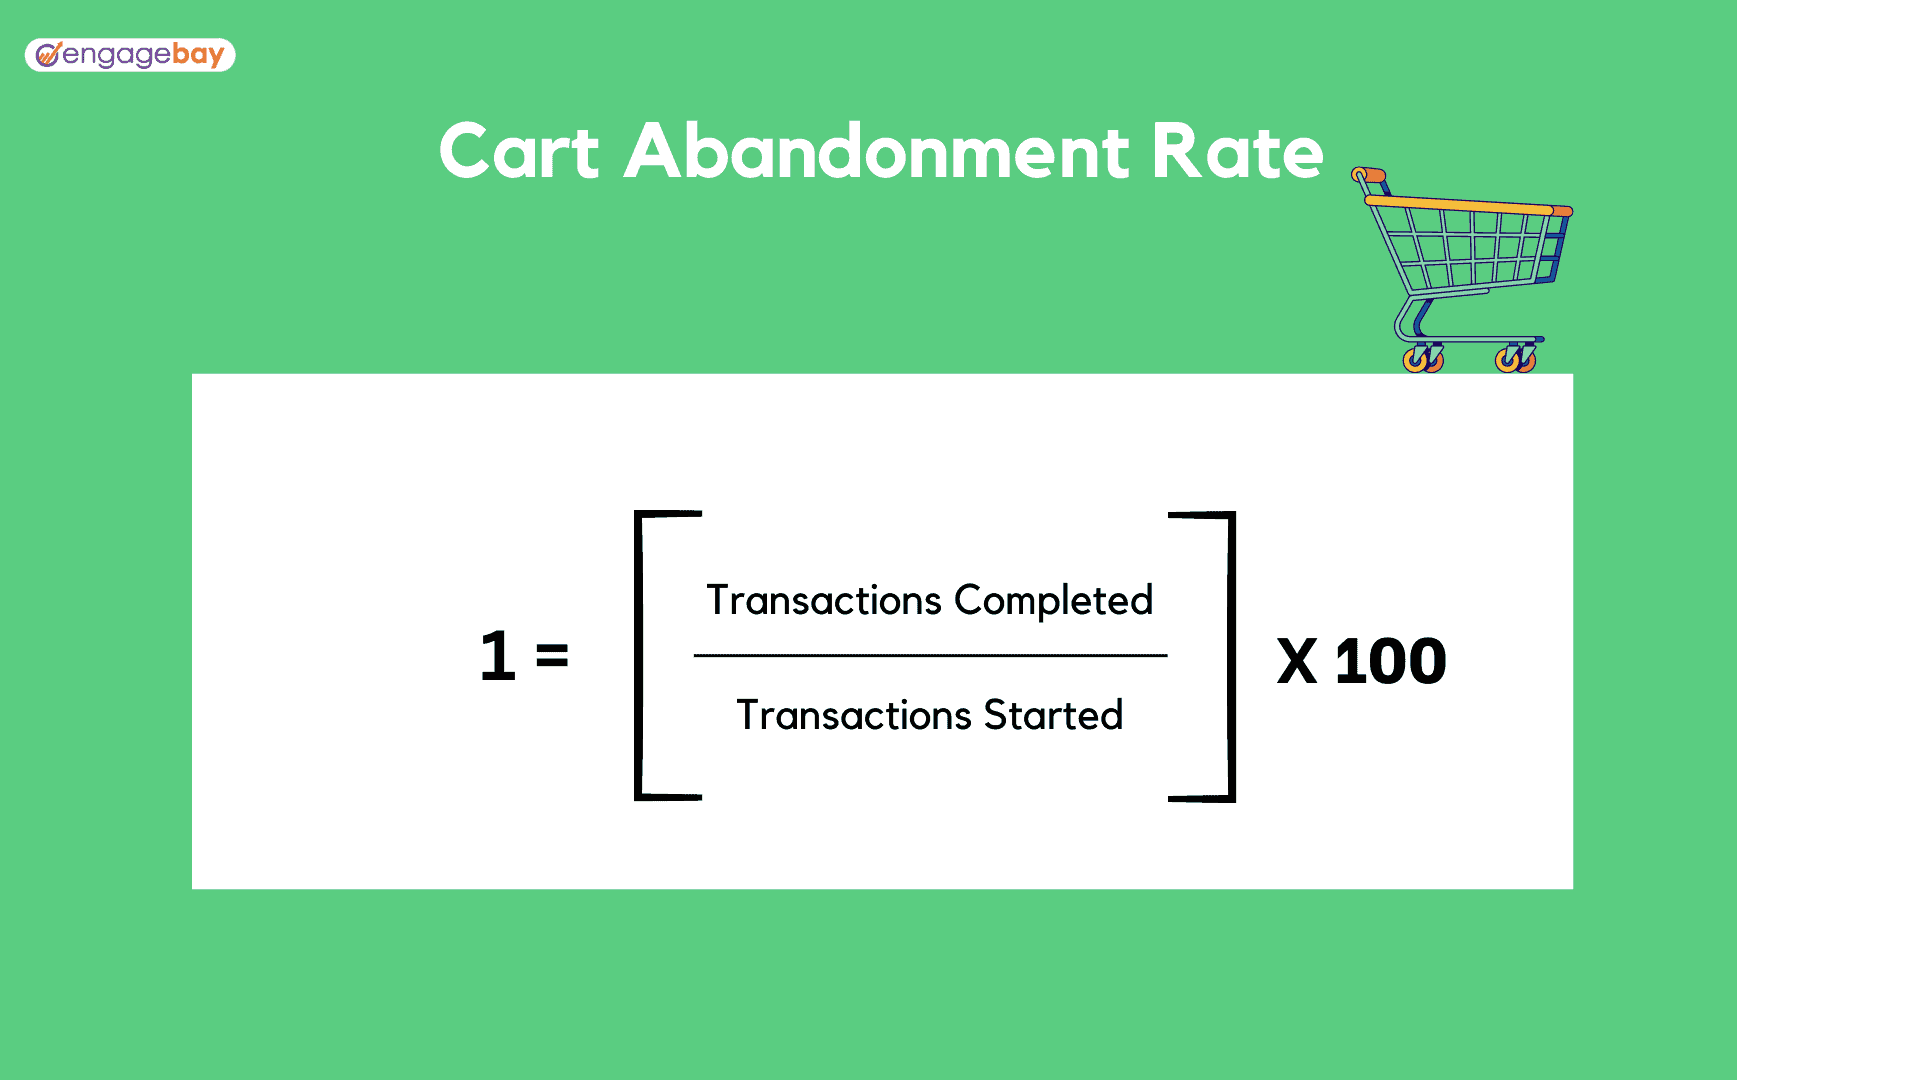
This KPI measures the success of your checkout process. The smoother and more intuitive it is, the lower your cart abandonment rate.
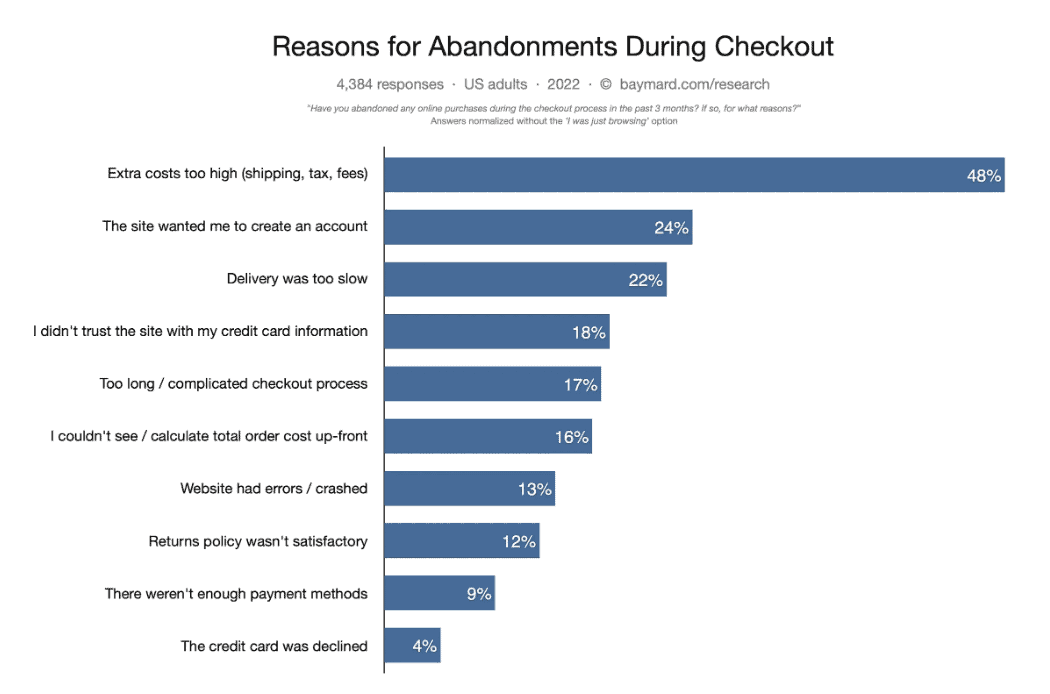
But, it also doesn’t give you a complete picture because there may be other reasons for cart abandonment. For best results, use this KPI along with Gross Profit Value, Average Order Value, and Conversion Rates.
Read also: Ecommerce Marketing: 8 Areas to Focus on to Increase Sales
4 KPIs for the Retention Stage
Here are the four most important KPIs for the retention stage of the customer journey.
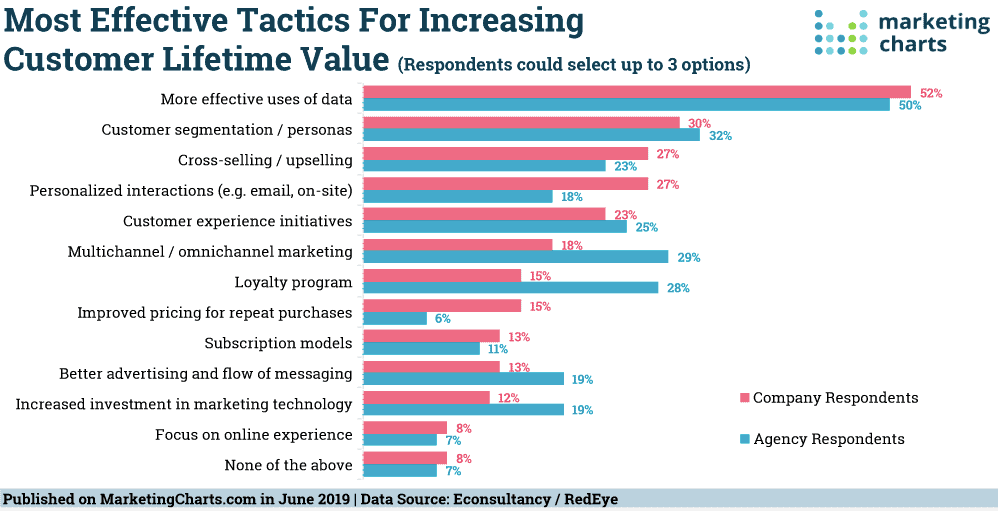
1. Customer Lifetime Value (CLV)
Customer Lifetime Value measures the total amount of revenue you’ve earned from one customer throughout your relationship with them.
It’s one of the most important metrics as it affects short-term and long-term marketing strategies. It also helps you predict how much revenue you’re likely to generate from a customer over time.
There are several methods companies can use to calculate their CLV. All these methods broadly fall under two categories — predictive calculation and historical calculation. Each business has to find the most accurate and effective method. You can also use online CLV calculators to make it easier.
Read also: Marketing Automation KPIs You Need Like Coffee (Must-Have)
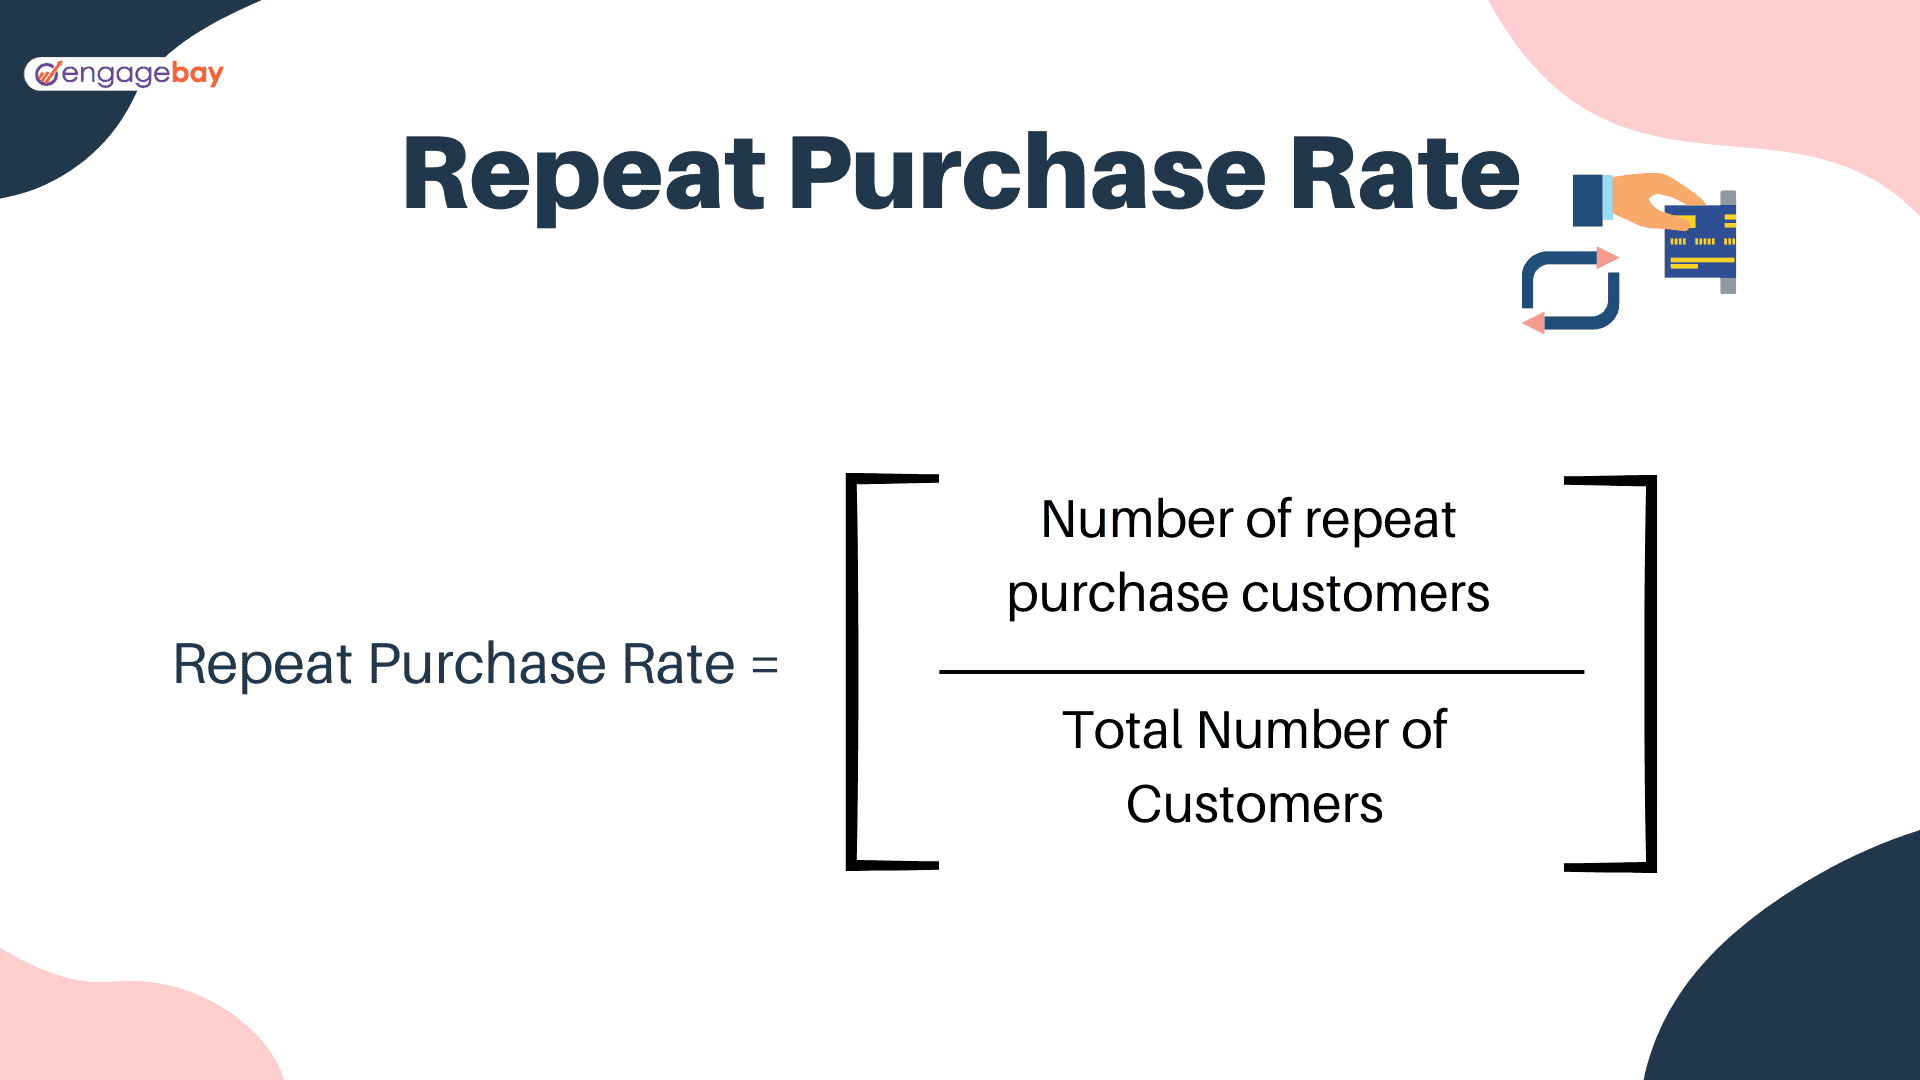
2. Repeat Purchase Rate (RPR)
The Repeat Purchase Rate (RPR) is a measure of the percentage of customers who have made repeat purchases from your brand within a specified period.
This is an important measure of customer satisfaction and customer loyalty. If your repeat purchase rate is extremely low, chances are there’s an issue with your product or customer experience. According to Alex Schultz, VP of Analytics and CMO at Meta, if just 20-30% of users make repeat purchases at your eCommerce store, then you’re doing a good job.
Here’s how you can calculate it.
3. Customer Satisfaction Score (CSAT)
The Customer Satisfaction Score (CSAT) is used to determine your customer’s satisfaction levels with various aspects of your business. This KPI can give you insights into the overall customer experience and pain points.
Even if you’re a rookie to eCommerce analytics, you’ve surely seen CSAT in action. When was the last time you gave customer feedback with answers on a scale from 1 to 5? This is the simplest way to gather data for calculating your CSAT.
Once you’ve got this data, use this formula to calculate your CSAT.
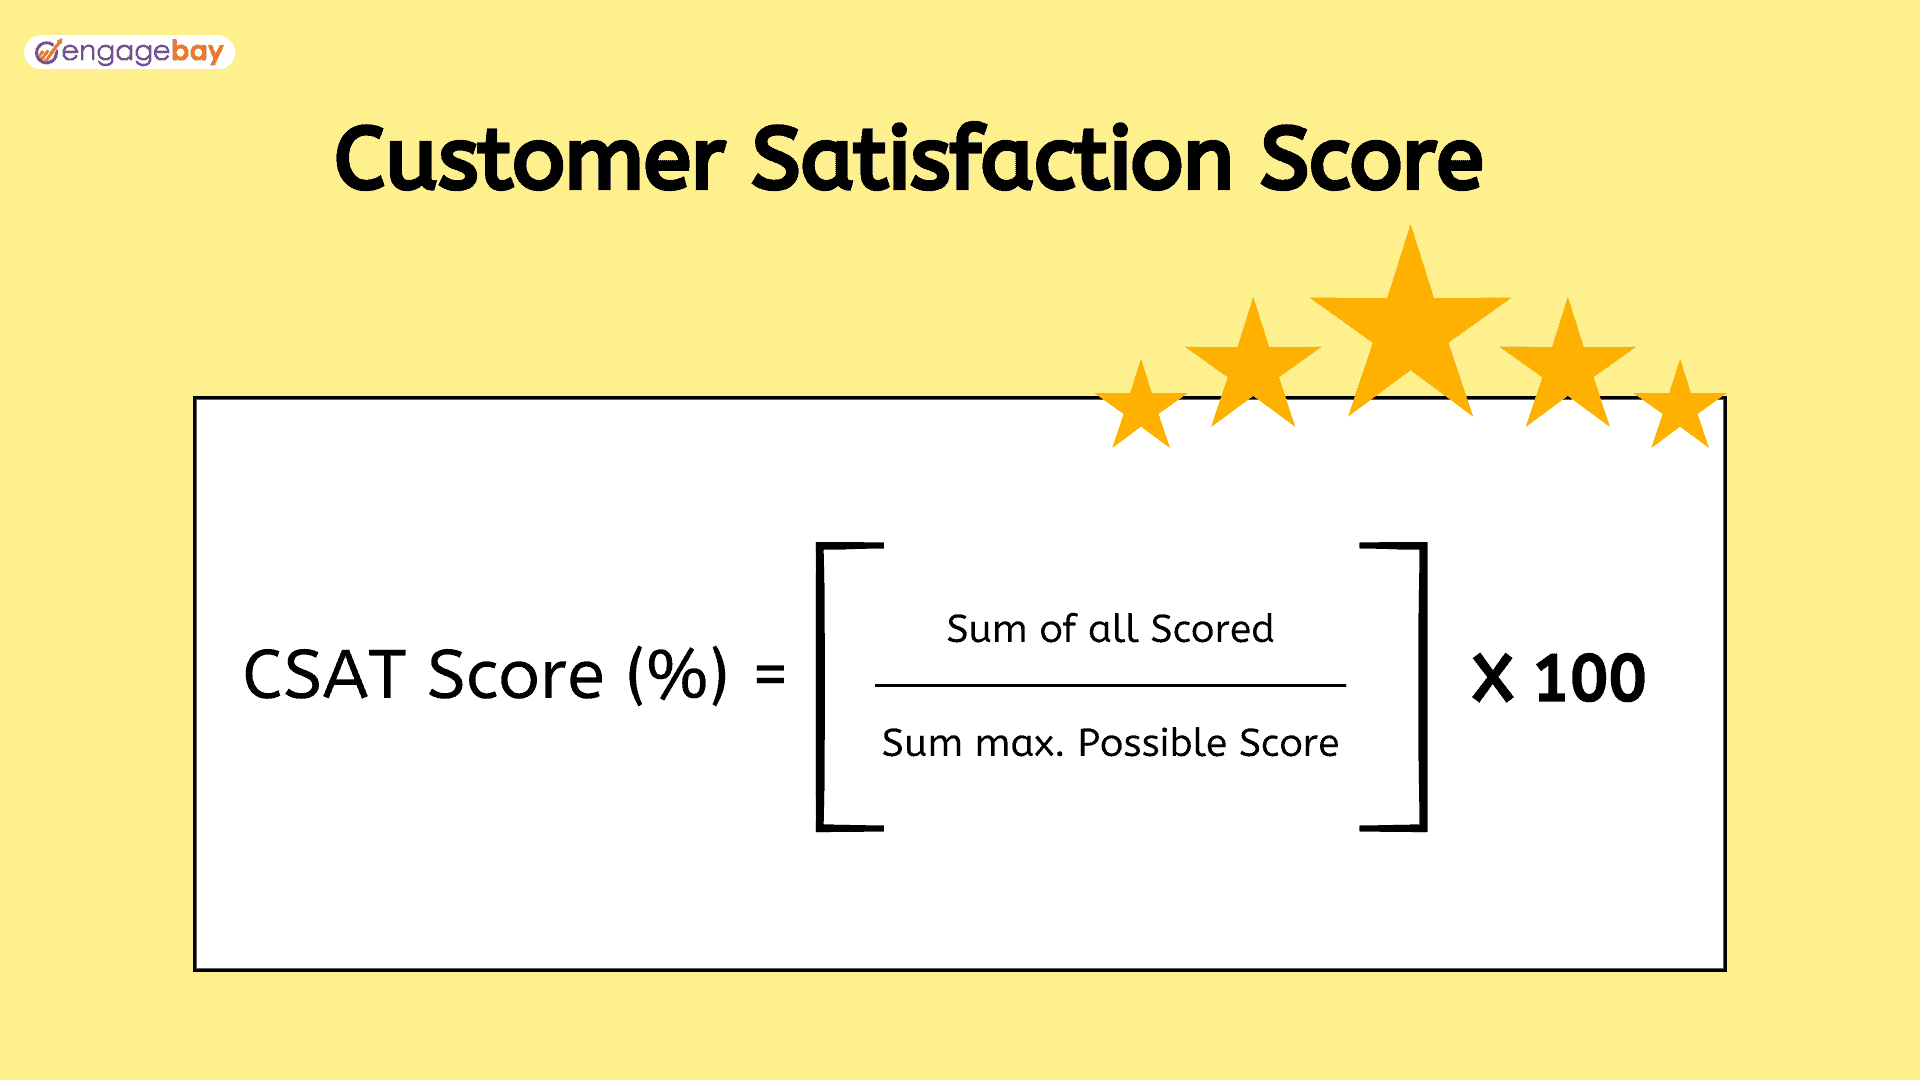
This KPI will not only improve customer experience but also will reduce your churn rate in the long run.
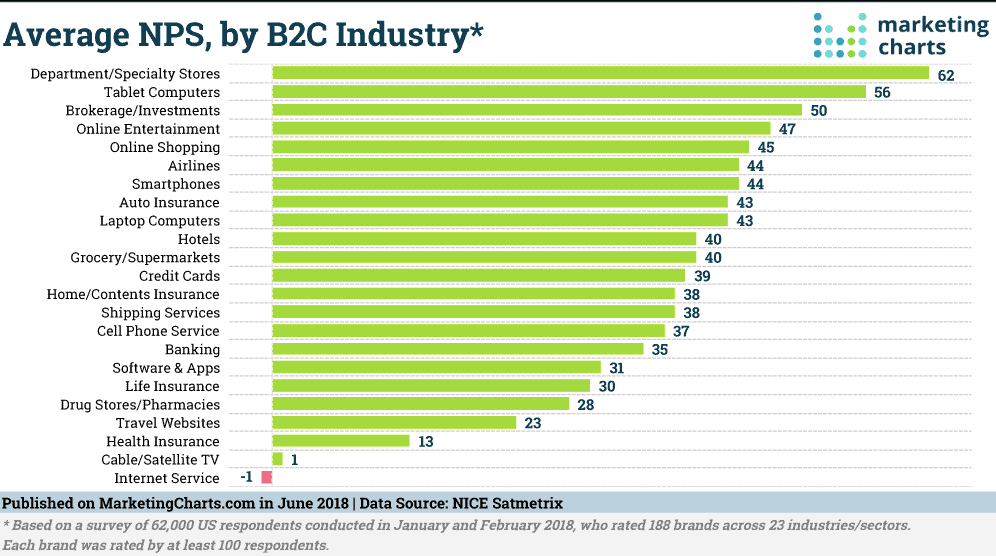
4. Net Promoter Score (NPS)
The Net Promoter Score (NPS) is a measure of your customer’s loyalty and satisfaction levels. It goes one step further than CSAT and asks customers if they’re likely to recommend your brand on a scale of 1-10.
A higher-than-average NPS score indicates possible revenue growth as customers are satisfied and loyal to your brand.
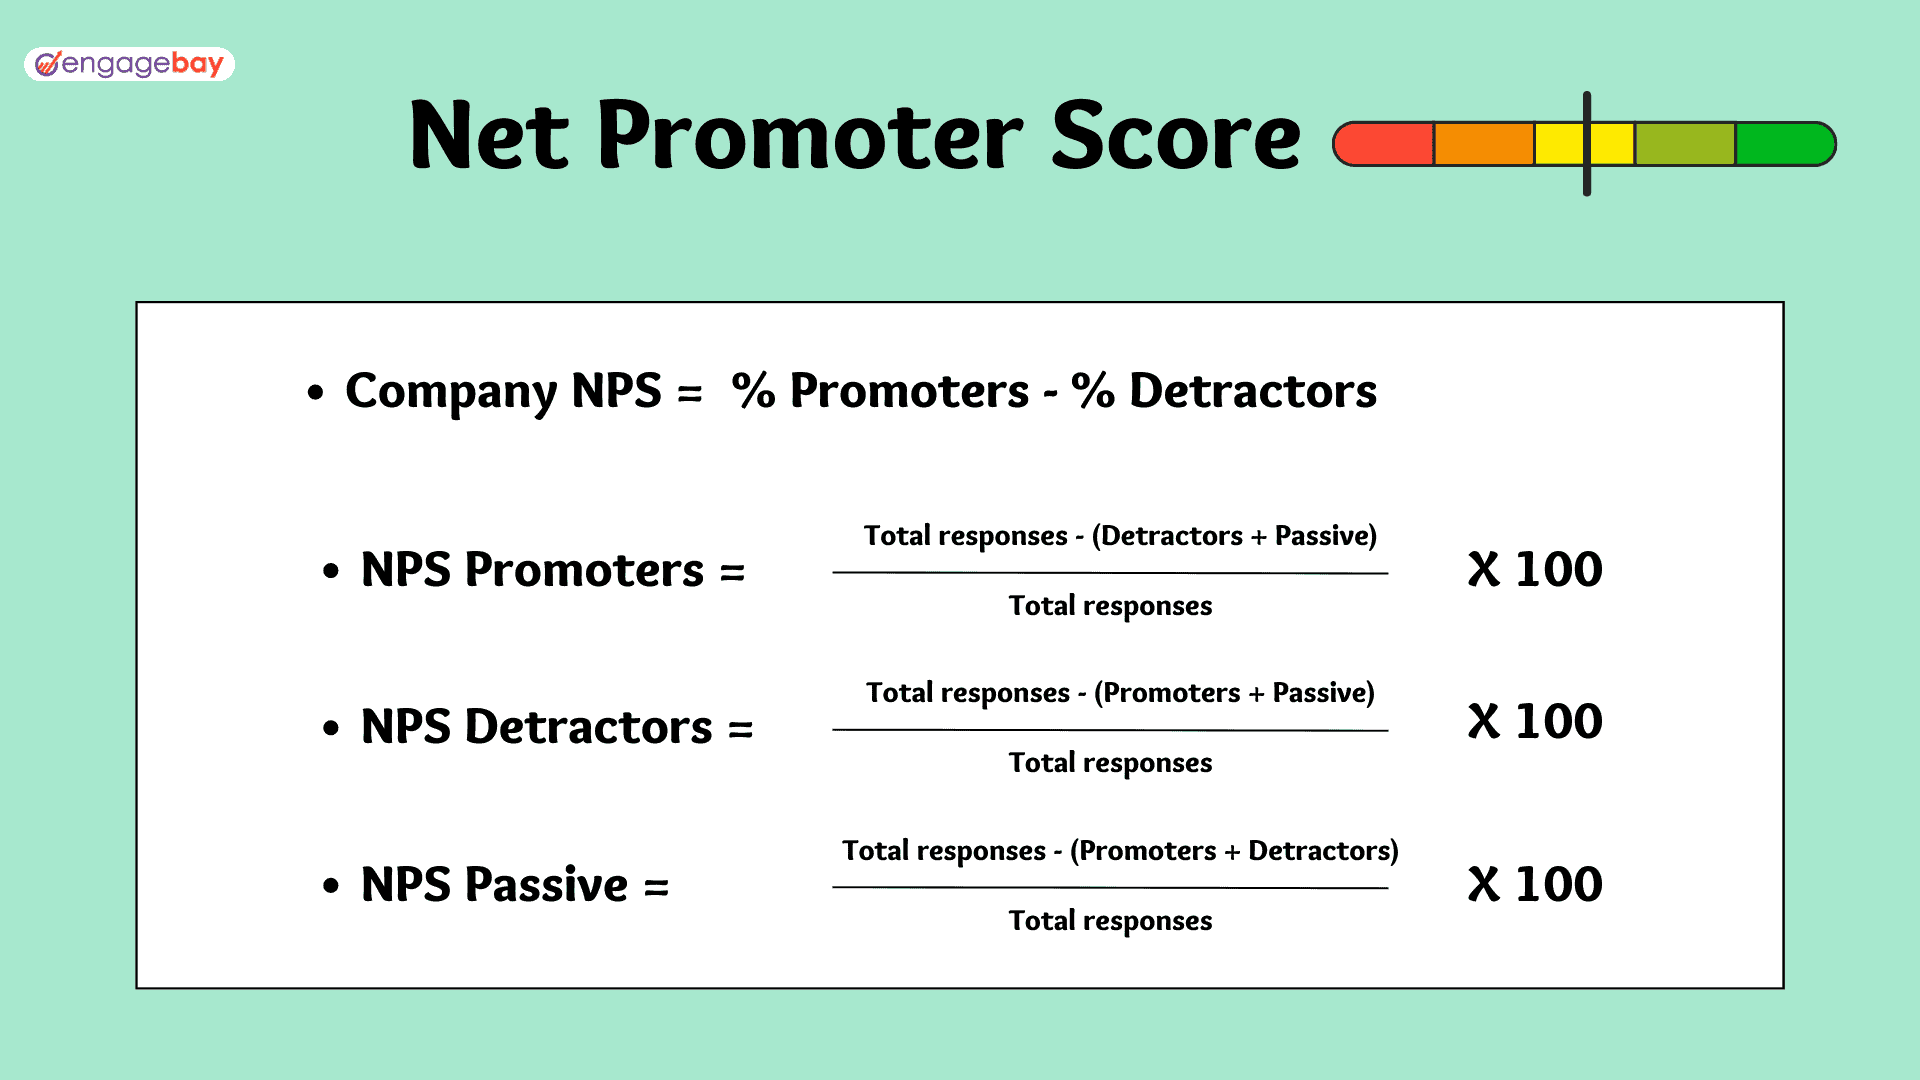
When customers respond to your survey, they are classified into 3 groups based on their responses.
- Promoters (with scores of 9-10): These customers are very loyal and likely to recommend your brand with enthusiasm.
- Passives (with scores of 7-8): These customers may be loyal to your brand, but they are also open to your market competitors.
- Detractors (with scores of 0-6): This segment of your customers is unhappy with your product or services. They may negatively affect your brand image.
Now that you know what these terms mean, you can use this formula to calculate your NPS.
Read also: eCommerce Sales Funnels 101: A Beginner’s Guide
How To Track and Analyze Important eCommerce KPIs?
There are several aspects to tracking and measuring eCommerce KPIs successfully. Here’s how to get started.
- Ensure that you carefully choose the KPIs that are most relevant to your eCommerce goals and growth. It’s best to avoid excessive focus on vanity metrics.
- Google Analytics is important for all eCommerce websites. But, for a 360-degree view and deeper analysis, find the right eCommerce analytics tools and eCommerce marketing tools that can be integrated with Google Analytics.
- Set realistic and practical benchmarks to measure your growth over time. This is based on your industry, target audience, business size, and business goals.
- Set up a regular schedule to examine your survey practices and other processes that go into data collection for eCommerce analytics. Keep updating this process and tweak your strategies and goals based on the data.
Read also: A Beginner’s Guide to Lead Funnels: How to 2X Your Sales
How To Leverage Google Analytics for eCommerce Analytics?
We’ve mentioned Google Analytics a fair amount, right? If you’re not fully familiar with GA, this section is for you. If you’re already a pro at Google Analytics (good on you 🥳), feel free to skip this section.
What Is Google Analytics? How does it work?
Google Analytics is one of the most popular web analytics tools in the market today. And, it’s free to use.
Every eCommerce marketer wants to improve their website traffic. With Google Analytics, you can pull up real-time data and reports to understand what’s driving prospects to your website and what’s not working out in your favor.
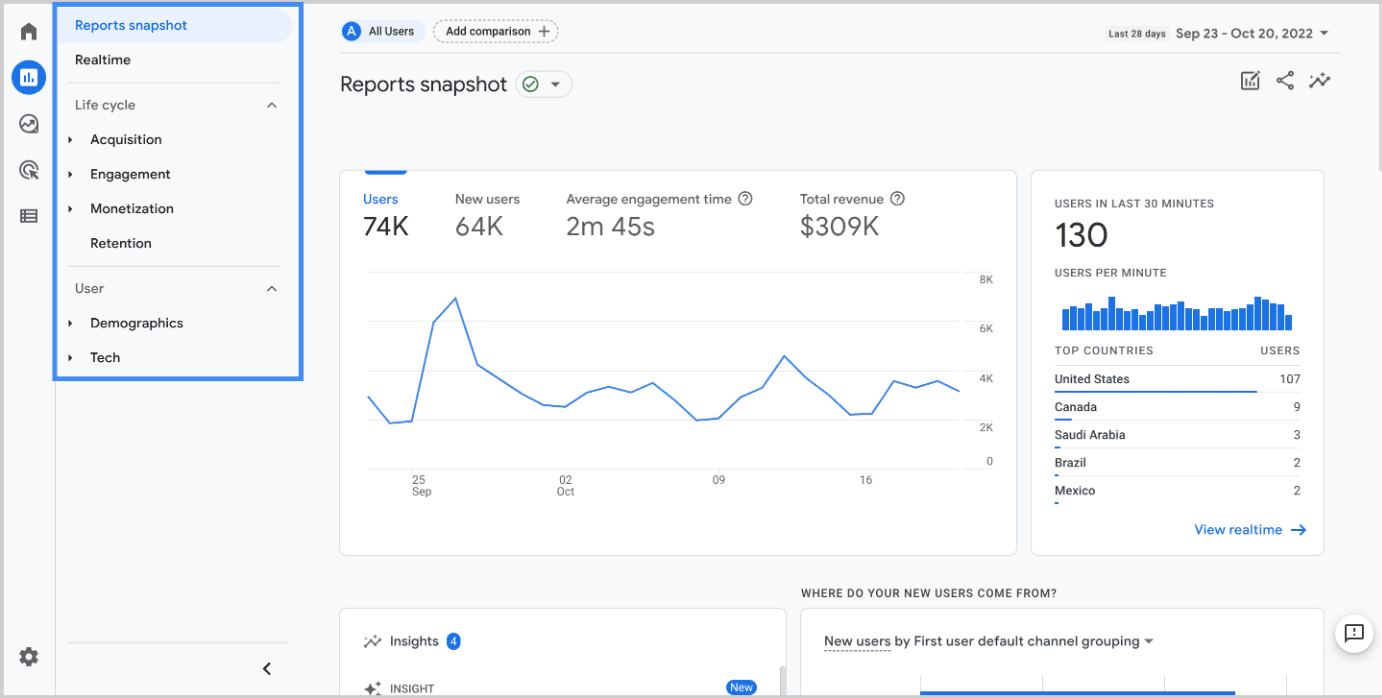
Without website analytics, you’re shooting in the dark without a clear awareness of how your prospects are responding to your marketing campaigns. Google Analytics has some paid features, but it’s mostly free. How does Google Analytics work?
GA can track activities and user behavior from your website using a piece of code known as tracking ID. This data is sent back to GA and aggregated. Then you can pull up reports for your eCommerce analytics based on certain parameters you’ve set.
What are the benefits for eCommerce companies using Google Analytics?
Most companies use Google Analytics in some form or another. Some of the major benefits for eCommerce and DTC companies are:
- Gain real-time insights into user behavior: GA gives you insights into what your users are interested in. You’ll get data related to average session times, bounce rates, and products they are interested in. This will help you segment your contact list and create targeted marketing campaigns to address the pain points of each segment.
- Monitor website and campaign performance: Once you’ve launched a marketing campaign, you can monitor its performance through GA and see whether you hit your target KPIs. It will also help you personalize and optimize your website to attract more prospects.
- Track conversions and get insights into each channel: Whether it’s data about your cart abandonment rate or your checkout process — there’s enough data to help you improve and track conversions. You can also get a fair picture of which marketing channels are the most lucrative for your store. All of this can help you take intelligent, data-based decisions and predictive analyses.
Read also: 8 Game-Changing eCommerce Integrations For 4X Growth
4 Simple Steps to Set Up Your Google Analytics
Anyone can sign up for an account with Google Analytics using their email ID. Here’s how eCommerce companies can set up Google Analytics.
1. Sign up on Google Analytics
You’ll need a Google account to get started. Begin by going to the Google Analytics homepage and entering your work email ID to create an account.
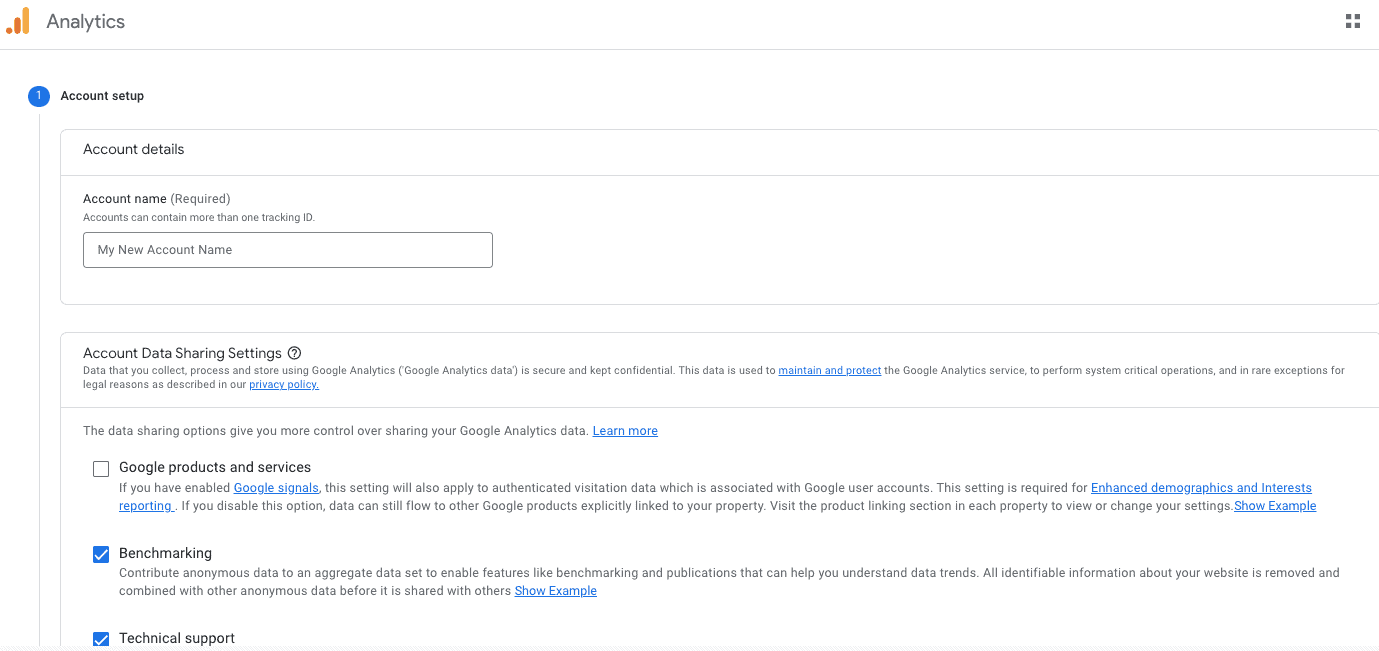
You’ll need to enter a bunch of info like:
- Your account name
- Website name and URL
- Your industry
- Time-zone
- Data sharing settings
Once you’ve correctly entered this data, click on the Create button. Your GA account is now ready.
2. Create and install the tracking code in your eCommerce store
A tracking code or a measurement ID is a piece of JavaScript that has to be added to every page of your eCommerce store. This tracking code makes it possible for Google Analytics to assimilate data from your web pages.
Once you create your account, you’ll be taken directly to the tracking code section.
There are two ways to add your tracking code.
You could directly copy and paste it into your website code or website template. Or, you could use a WordPress plugin that automatically enables the tracking code on each web page.
If you don’t want to modify your website’s code, then you can also use Google Tag Manager to create a GTM container. This GTM container is a snippet of code that lets you manage all your analytics tags from the GTM interface.
3. Create and add your goals to be monitored
Once you have added different users from your team, you’re ready to set up your goals. You’ll have to create a custom goal or use one of Google’s goal templates.
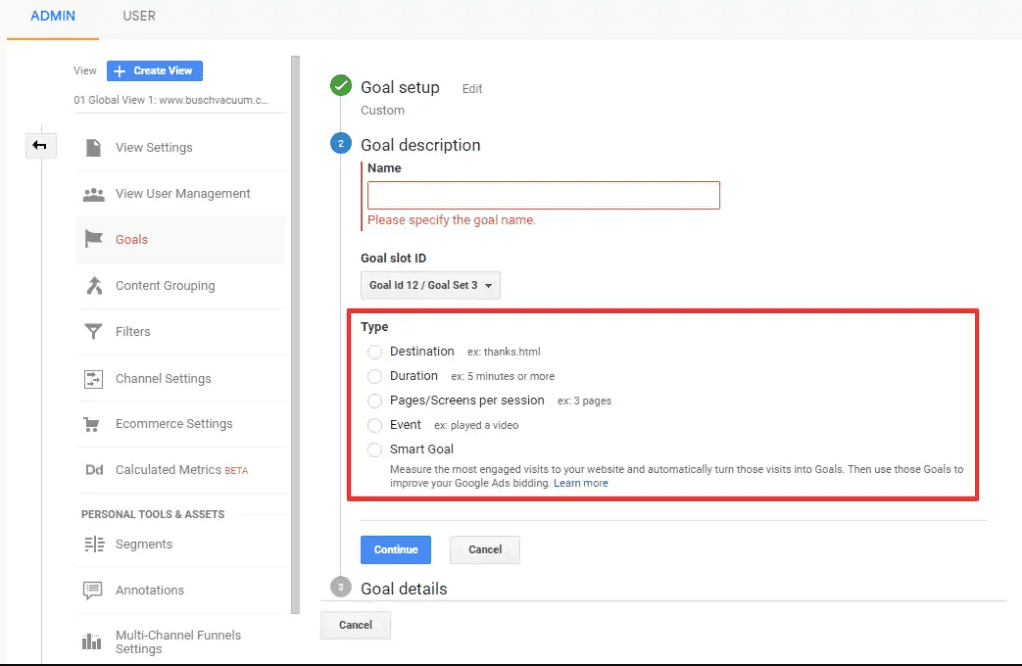
There are four goal types you can choose from. Here’s how they are different.
- Destination Goals: This is perfect for a thank you page or your checkout page. Each time a person visits your web page, the destination goal is triggered. It helps you track the number of visitors to each web page.
- Duration Goals: Here, this goal is triggered based on the amount of time a visitor spends on your website. This is a great option when you need to track your audience’s engagement levels.
- Pages/screens per session: This goal is triggered by the number of pages a visitor navigates before leaving your website. It gives you a sneak peek into your overall website engagement levels.
- Event: Event goals allow for more flexibility in terms of the actions that trigger the goal. With Google Tag Manager, you can create a goal if a threshold of scroll depth and a pre-defined duration is crossed. This is ideal for tracking your lead magnets, form conversions, or button clicks.
- Smart goal: Google uses machine learning techniques to allow some users to create smart goals. This is only open to accounts that have linked Google Analytics and Google Ads. Smart goals help you determine goal thresholds and apply them.
4. Enable eCommerce Tracking from the admin section
The eCommerce tracking section allows you to track eCommerce data directly. This includes billing and checkout data, products with high or low sales, average order value, conversion rates, and purchasing trends.
You can integrate third-party shopping carts (like Shopify) into your GA account. Adding a server-side script can also help gather data for Google Analytics at this stage.
Read also: Proven Behavioral Targeting Examples (and Why They Work)
How Does eCommerce Analytics Help Uncover Customer Behavior?
What else can Google Analytics do for your eCommerce store?
As it turns out, a lot more.
You can get a wealth of insights into customer behavior with the Shopping Behavior Report and the Checkout Behavior Report.
Shopping Behavior Report
Here’s a sample report. You’ll have to set up Enhanced eCommerce Reporting on Google Analytics to get access to this.
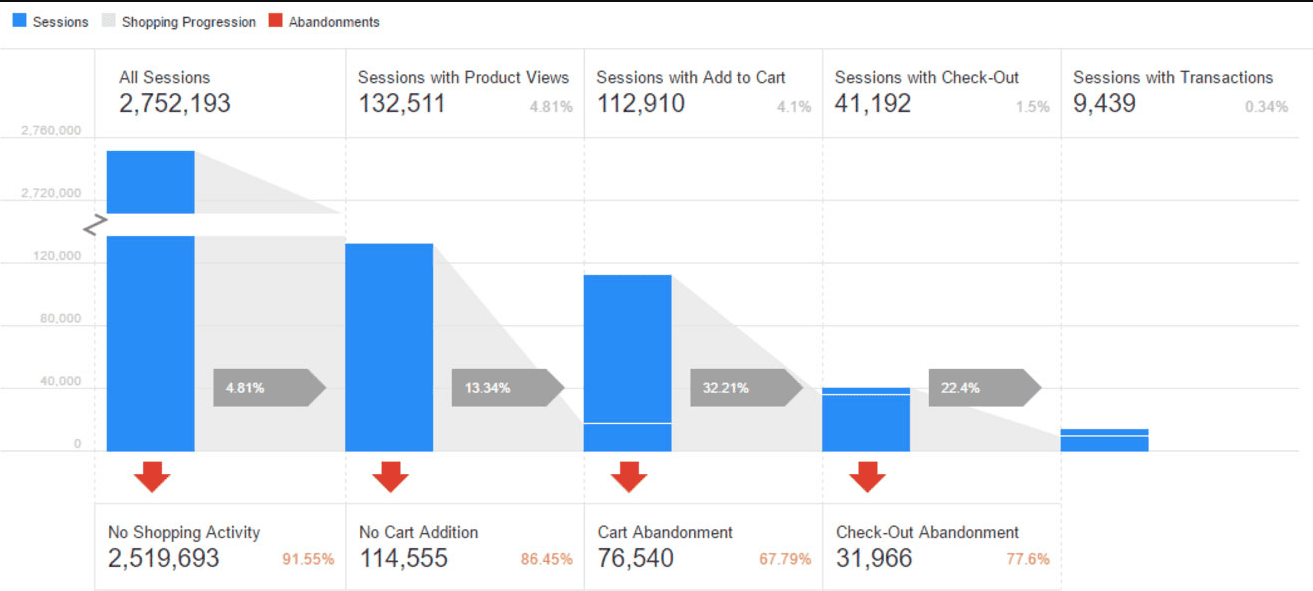
This feature gives you a visualization of customer behavior at each stage of the buyer’s journey. Starting with how many users viewed product pages — it goes on to show each segment of the buyer’s journey until a purchase is made.
Consider creating custom segmentations for your report. You’ll see a table at the end where you can see your funnel and segmentations based on location, browser, user type, and campaign. This can also help you optimize your buyer journey and marketing funnel. You can also improve your checkout process using the checkout behavior report.
These reports are a crucial part of your funnel performance analysis and user retention analysis. So, ignore it at your own risk.
Read also: 19 eCommerce Best Practices to Win Customer Confidence
The Real Significance of Customer Behavior in eCommerce
If only eCommerce marketers had a crystal ball that let them predict user behavior! Since we don’t have this, customer behavior analytics is our best bet.
Here’s why no eCommerce marketer can ignore customer behavior analytics:
- Identify and solve customer pain points. Without customer behavior analytics, you’re not going to get a clear picture of where new leads are dropping off in the funnel. If you see recurring patterns in customer behavior, then you know it’s an issue you have to fix.
- Get quality leads and improve conversion rates. By changing your strategies based on user behavior, you’re more likely to find marketing tactics that resonate with your target audience. This improves customer experience and conversions.
- Improve website usability. You’ll be able to understand what web pages are proving complicated or difficult to navigate and make changes to your website.
- Deliver targeted marketing messages. Based on user behavior and site search analysis, you can deliver the right message to the right prospect at the right time. This ensures that your marketing campaigns remain relevant and effective.
- Marketing channel analysis. You’ll be able to uncover the marketing channels that are most effective with each audience segment. This means more conversions and revenue.
- Gain a competitive edge. If you’re able to identify issues and pain points and improve your customer experience, then this gives you a competitive advantage in your product niche.
Read also: 15 Easy Steps to Build a Personalized eCommerce Marketing Plan
Top 5 eCommerce Analytics Tools in 2023
Click on any of these five picks for eCommerce analytics tools to learn more. We’ll help by breaking down the pros and cons of each tool.
Pros and cons
| eCommerce Analytics Tool | Pros | Cons |
| Google Analytics |
|
|
| Adobe Marketing Cloud |
|
|
| Kissmetrics |
|
|
| Hotjar |
|
|
| Mixpanel |
|
|
A breakdown of pricing plans
| Google Analytics | Adobe Marketing Cloud | Kissmetrics | Hotjar | Mixpanel | |
| No. of Pricing Plans available | 2 (including free plan) | Variable Pricing Plans based on requirements.
A basic license costs $450,000 + additional costs. |
3 (no free plan available) | 4 (including free plan) | 3 (including free plan) |
| Starter Plan | Free | Contact vendor for all pricing plans | $299 per month | Free up to 35 daily sessions | Free for 100K monthly users |
| Mid-Tier Plan | N/A | N/A | $499 per month | $80 per month for 500 daily sessions | $20 per month + add-on costs |
| Premium Plan | $12,500 per month or dynamic pricing for GA 4 | N/A | Contact Vendor | $171 per month for 500 daily sessions | $1,667 per month + add-on costs |
| Free Trial | No Free Trial | No Free Trial | Free Trial Available | 15-Day Free Trial | Free Trial Available |
Read also: B2B eCommerce Trends: These Strategies Can Boost Your Business
Until Next Time …
We hope this article was useful for eCommerce business owners to understand how to ace analytics with the right eCommerce KPIs.
If you can implement these ideas, you’ll be on track to creating a better customer experience and building trust for your brand. Let us know your thoughts in the comments below.