How do you know if your eCommerce business is smashing it or underperforming?
Building a highly successful eCommerce business isn’t a walk in the park. Without regularly evaluating your eCommerce performance with the right metrics, your chances of success are slim.
Conversely, tracking your eCommerce performance with the right metrics could be your ticket to bagging a chunk of the estimated 6.3 trillion dollars in eCommerce sales (in 2023).
To keep you from getting overwhelmed, we’ve divided the eCommerce metrics into two parts—one for beginners and the other for experienced business owners.
Here’s a preview of what we cover in this blog post:
- The top 21 eCommerce metrics to focus on
- eCommerce metrics you should be tracking based on your experience level
- Why some eCommerce metrics are essential to track
- How to calculate the most important eCommerce metrics
- Tips for driving growth for your eCommerce business
- Frequently asked questions about eCommerce metrics
Table of Contents
eCommerce Metrics for Beginners
- Website Traffic
- Conversion rate
- Average Order Value (AOV)
- Customer Lifetime Value (CLV)
- Bounce Rate
- Cart Abandonment Rate
- Gross Profit Margin
- Net Promoters Score
- Customer Satisfaction Ratings
- Customer Reviews
1. Website Traffic
Website traffic is designed to track the number of people who visit your website from a search engine or other online sources. This number can help you measure your eCommerce marketing strategy’s success in attracting new visitors.
It’s crucial not just to track website traffic but also to track the average time a visitor spends on your site. Traffic is sourced from paid methods (paid ads, influencer, and affiliate marketing) and free methods (organic search or referrals).
Whichever method you use to attract web visitors, it’s essential to monitor your website traffic to ensure it’s growing and meeting your goals.
Manually tracking your eCommerce website traffic can be daunting. The good news is, with EngageBay’s web analytics tool, you can easily track your eCommerce website traffic and unique visitors. It gives you real-time insight into where your traffic comes from and even tracks the average session duration in a beat.

6 High-Impact eCommerce Marketing Strategies to Try Now
2. Conversion rate
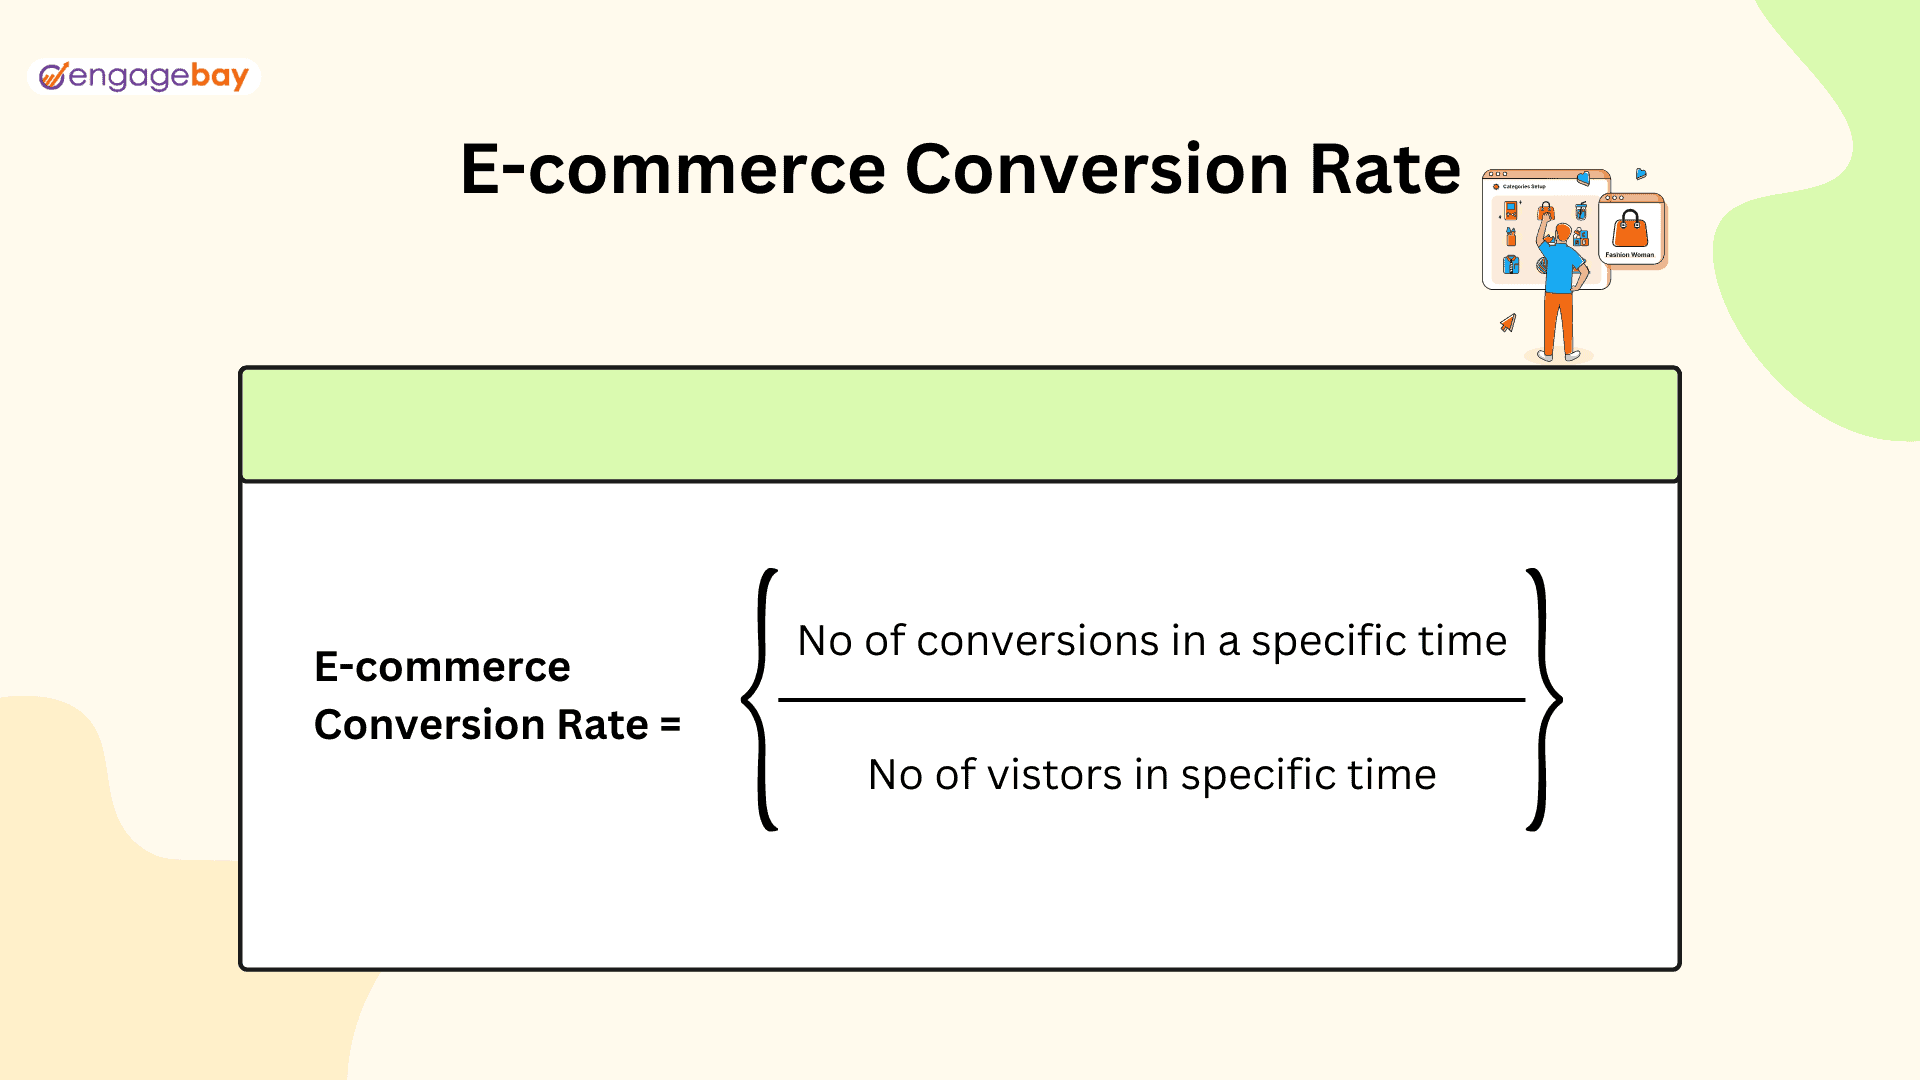
Conversion rate is an important metric to track in eCommerce marketing. It’s the number of visitors who convert or buy a product or service from your website. This number helps estimate the effectiveness of your online marketing campaigns in attracting qualified leads.
Your conversion rate should be high enough to continue advertising and landing page campaigns without losing too much money from visitors who do not convert. Below is an eCommerce conversion rate benchmark by industry to keep you in check.
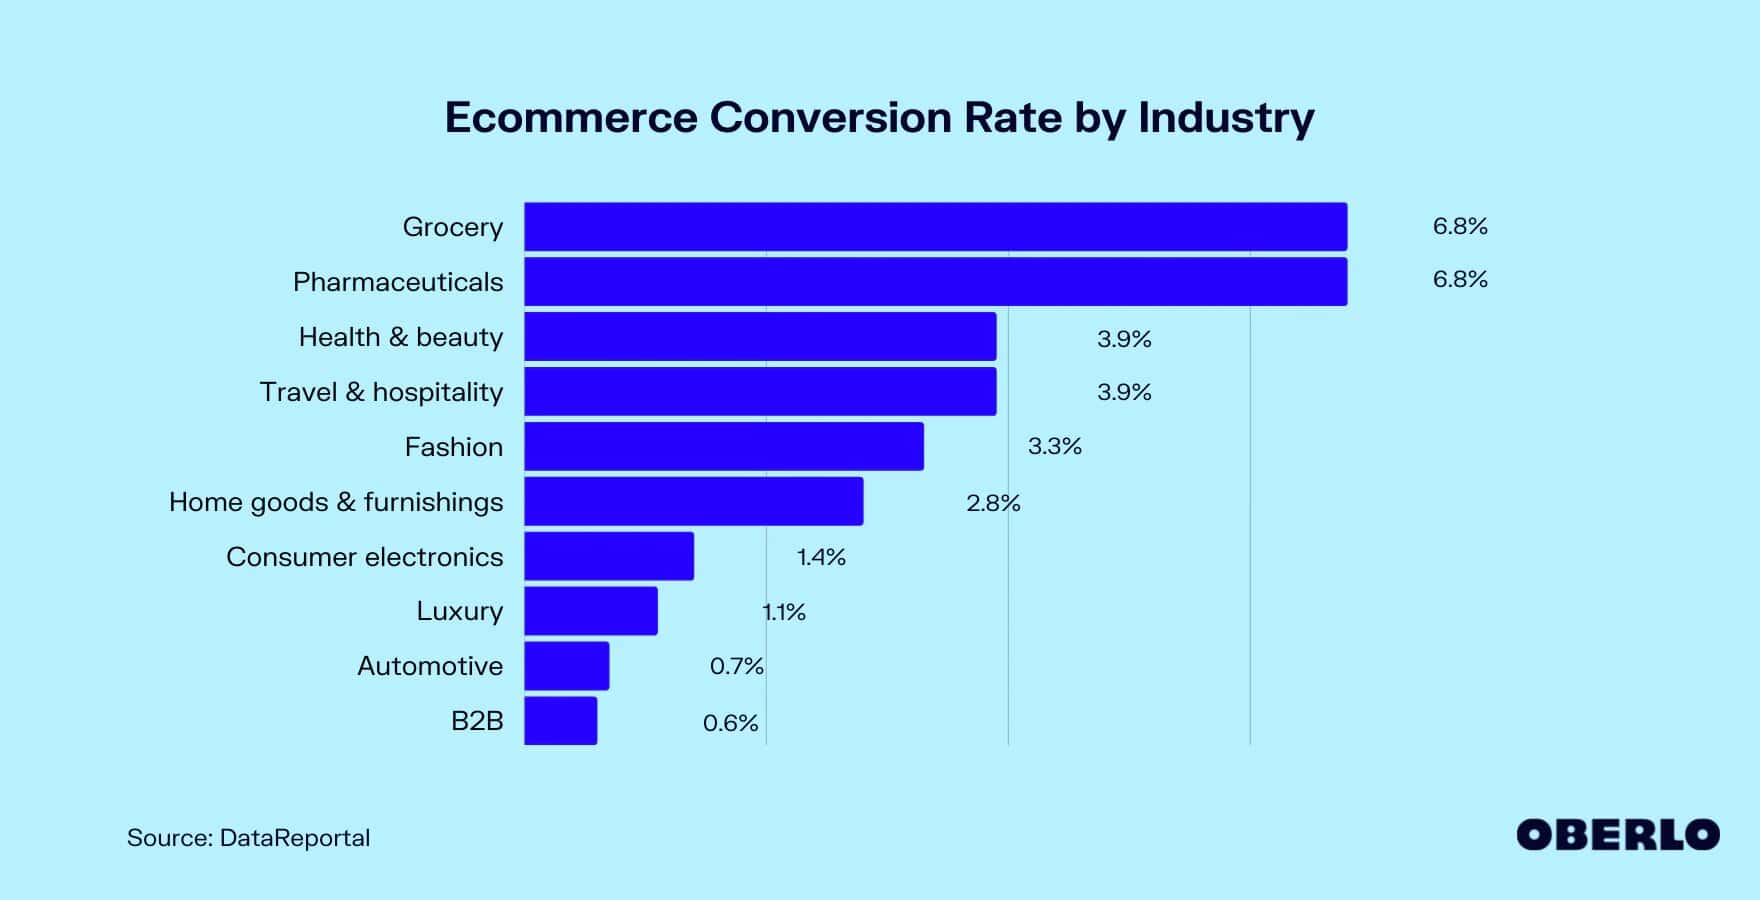
Additionally, you can track your conversion rate to determine which areas of your website are most effective at converting visitors into customers.
For example, if your conversion rate is high on your homepage but low in other areas of your website, focus your marketing efforts on the homepage. Knowing which pages are converting, you can focus your efforts on those pages. This ensures that your marketing messages get through to your visitors.
Alternatively, if your conversion rate is low on certain products but high on others, you should re-optimize such products for better conversions.
To calculate your conversion rate, divide the total number of visitors by the total no. of conversions (in this case, the total number of purchases) in a given period. Then multiply your answer by 100.
With EngageBay’s automated A/B testing feature, you can easily scale your conversion rates. It has an easy drag-and-drop feature helps you quickly implement changes to your web page without coding.
You can increase your eCommerce sales by tracking your conversion rate and using this information to improve your ecommerce marketing strategy.
17 Fab Ideas for eCommerce Business
3. Average Order Value (AOV)
It’s the average amount your eCommerce customers spend on purchases in a single transaction. This statistic gives you a snapshot of how much your customers spend on your products.
By understanding your AOV, you can determine which products are selling well and which need to be tweaked or redesigned.
To calculate your AOV, divide the total revenue from all eCommerce orders in a set period (best to track it monthly) by the no. of orders taken within the specified period.
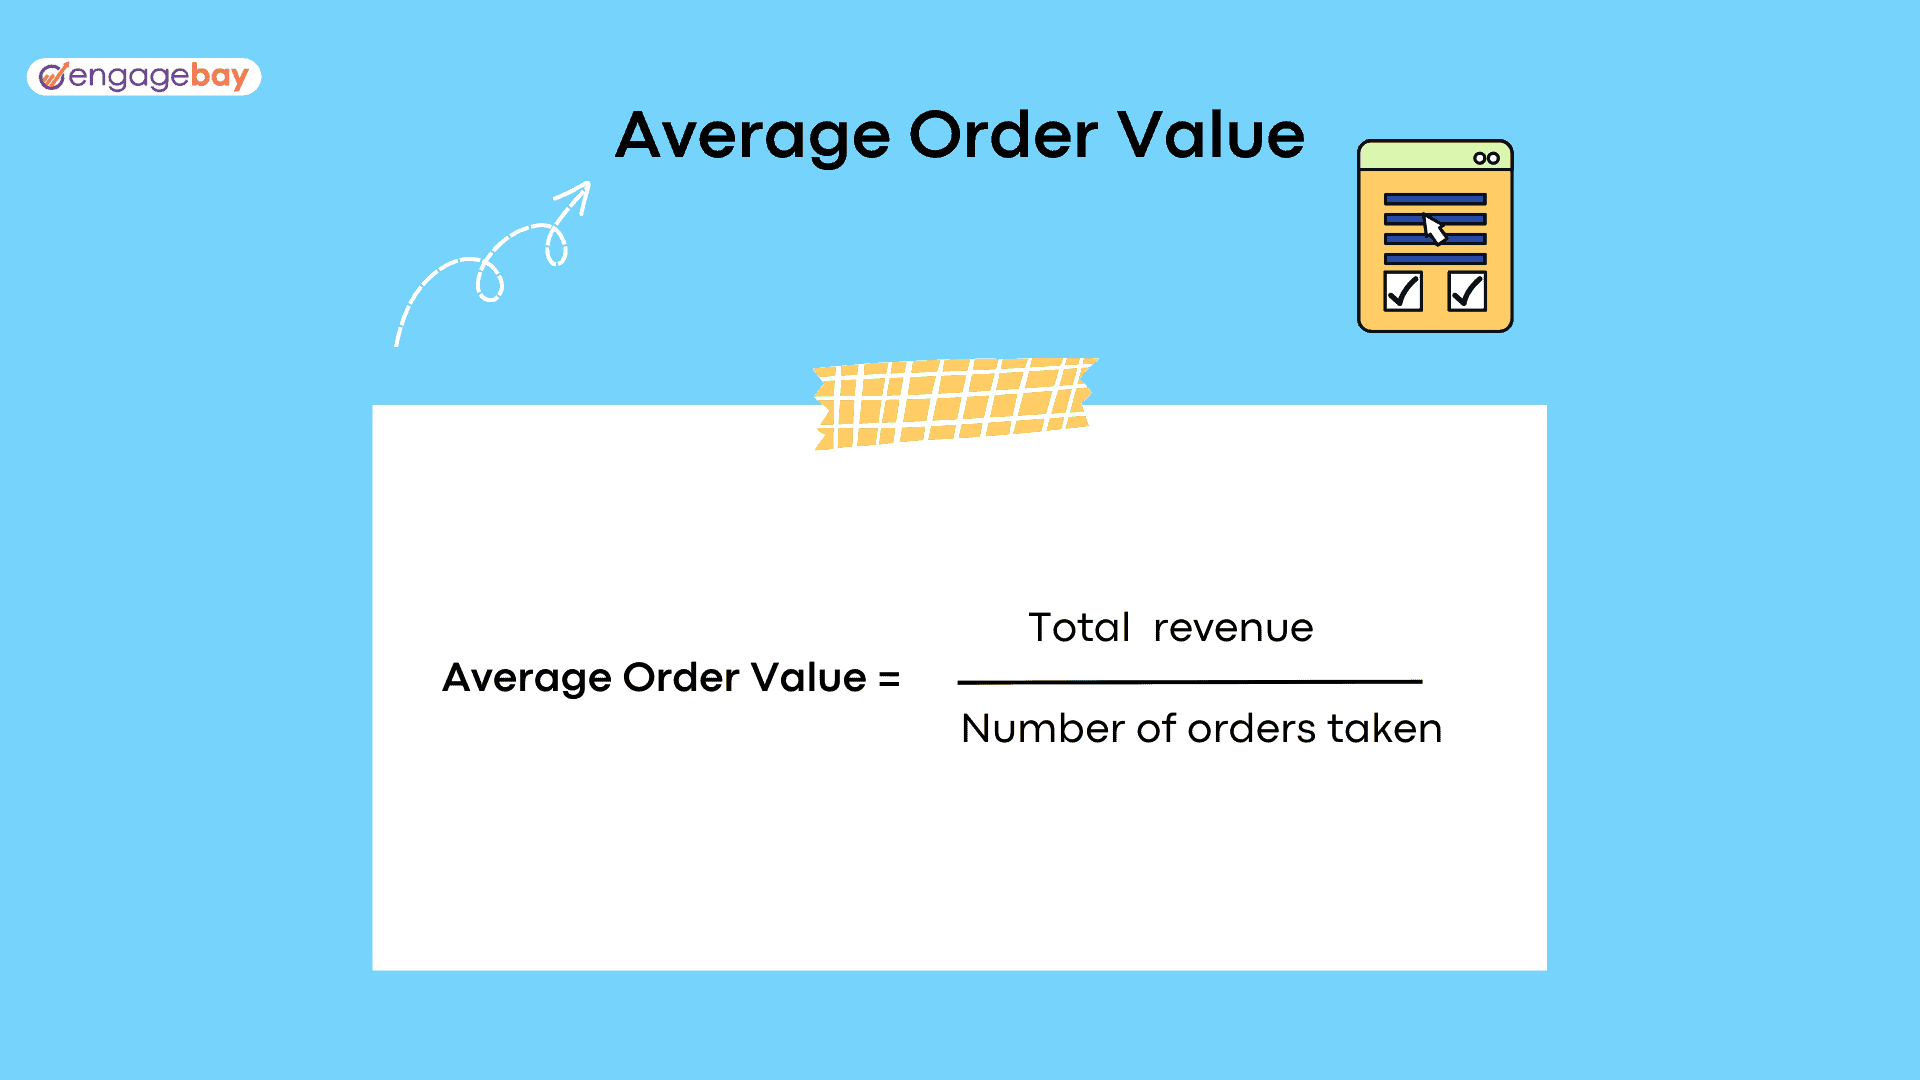 Using the formula, suppose your total value of orders in a given month is $30,000, and the number of completed orders is from 200 customers. Your AOV would be $150 per customer.
Ecommerce Marketing: 8 Areas to Focus on to Increase Sales
4. Customer Lifetime Value (CLV)
CLV is a metric used to measure the worth of a customer to your eCommerce business throughout their time with you. It is a critical metric for eCommerce businesses because it is a strong indicator of the long-term success of a business. Calculating customer lifetime value is essential to maximize eCommerce profits and optimize customer service.
To calculate your customer lifetime value, you need three crucial data:
Customer Purchase Frequency Rate (PFR). This is the average number of times a customer buys from you over a specific period.
Average Customer Lifespan (ACL). This is the average time a customer will remain in business with you.
Average Order Value (AOV). This is the average amount a customer spends per transaction.
With the above in place, you can calculate your CLV using this formula: CLV = AOV x ACL x PFR
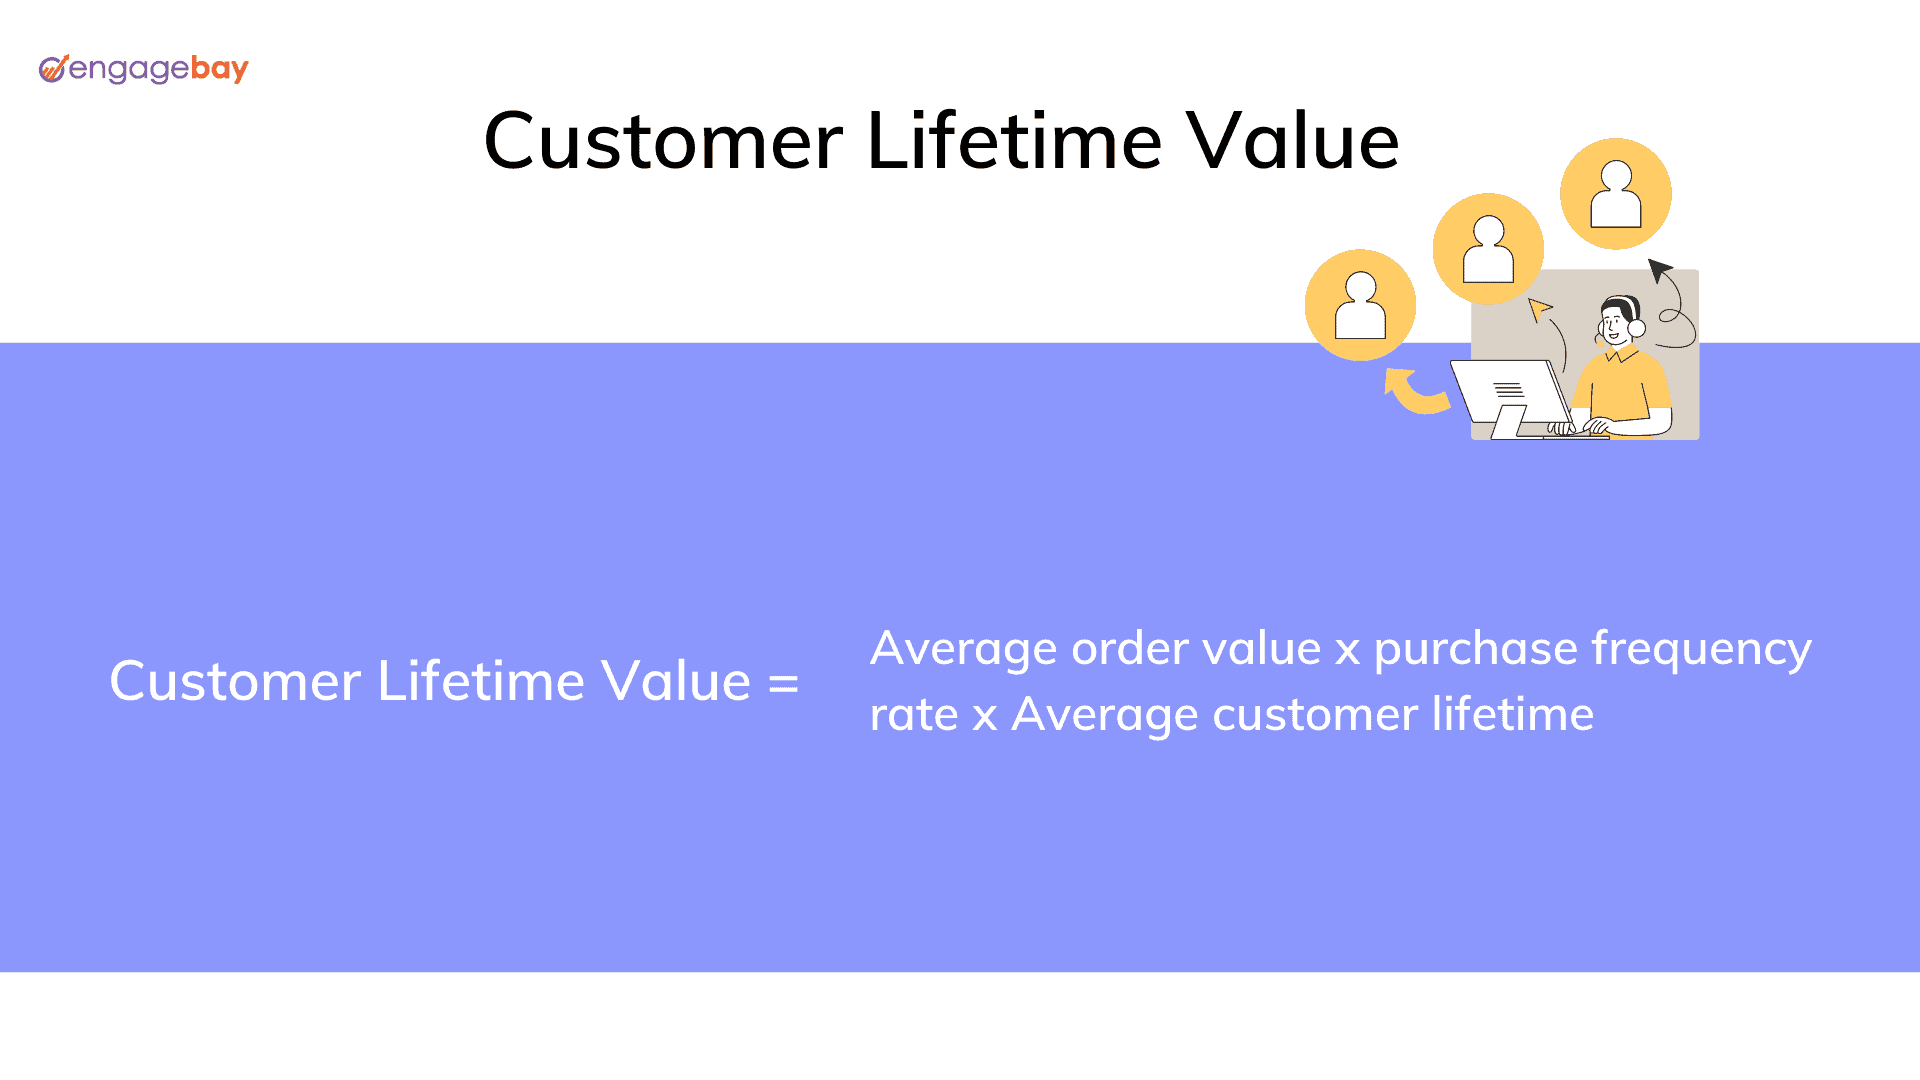 Suppose your eCommerce customers spend $150 per order on average, continue to buy from you for eight years, and place six orders yearly. Then your CLV would be $150 x 8 x 6 = $7,200.
It is important to note that CLV is a long-term metric and can fluctuate over time depending on your customer’s purchasing habits. Thus, tracking customer lifetime value at intervals is essential to correctly measure and understand a customer’s current and potential value to your eCommerce business.
Read also: How To Optimize Your CTR With eCommerce Email Heatmap Analysis
5. Bounce Rate
Bounce Rate is designed to give insight into the percentage of visitors who exit your site after only visiting a page.
Google Analytics 4 (GA4), which is the updated version of Google Universal Analytics (UA), defines bounce rates quite differently.
GA4 says bounce rate is “the percentage of sessions users weren’t engaged.”
That means if a visitor visiting a single page leaves your site within 10secs and doesn’t interact with anything on your page, it is considered a bounce.
The most popular way to track your bounce rate is using Google Analytics. The image below shows the average bounce rates per industry.
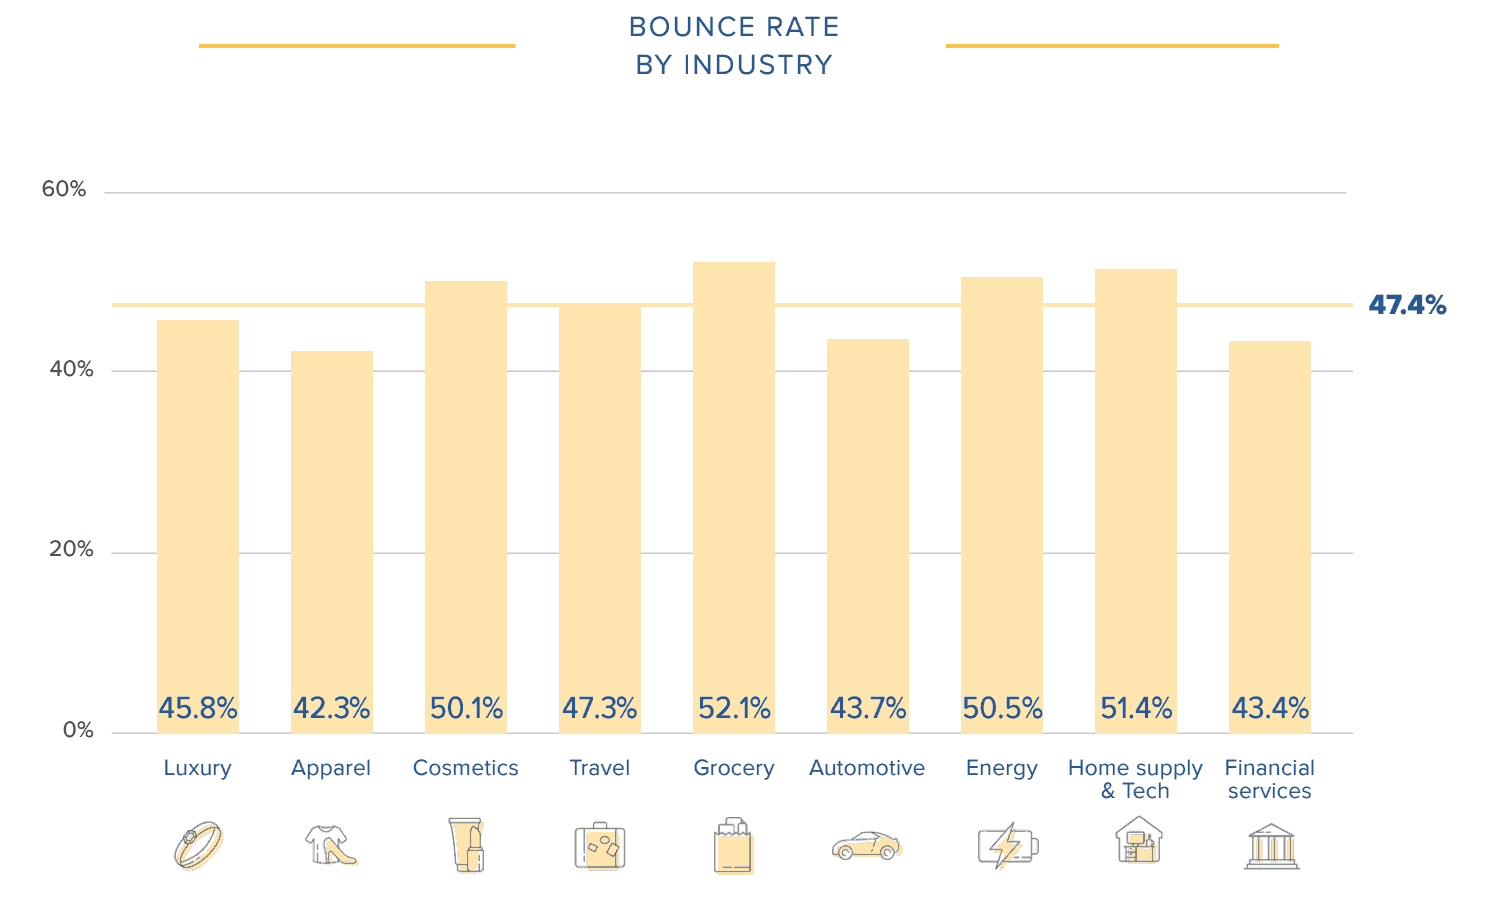
Low-quality content is often cited as the reason for high bounce rates. Although that holds, another common yet often ignored cause for high bounce rate is misleading meta description/ title tags. Deliver what you promised in your meta description and title tags to keep your audience from “bouncing”.
Read also: The Advantages and Disadvantages of eCommerce
6. Cart Abandonment Rate
There’s no doubt that online shopping is growing in popularity every day. And with that growth comes the need for merchants to find ways to reduce the cart abandonment rate.
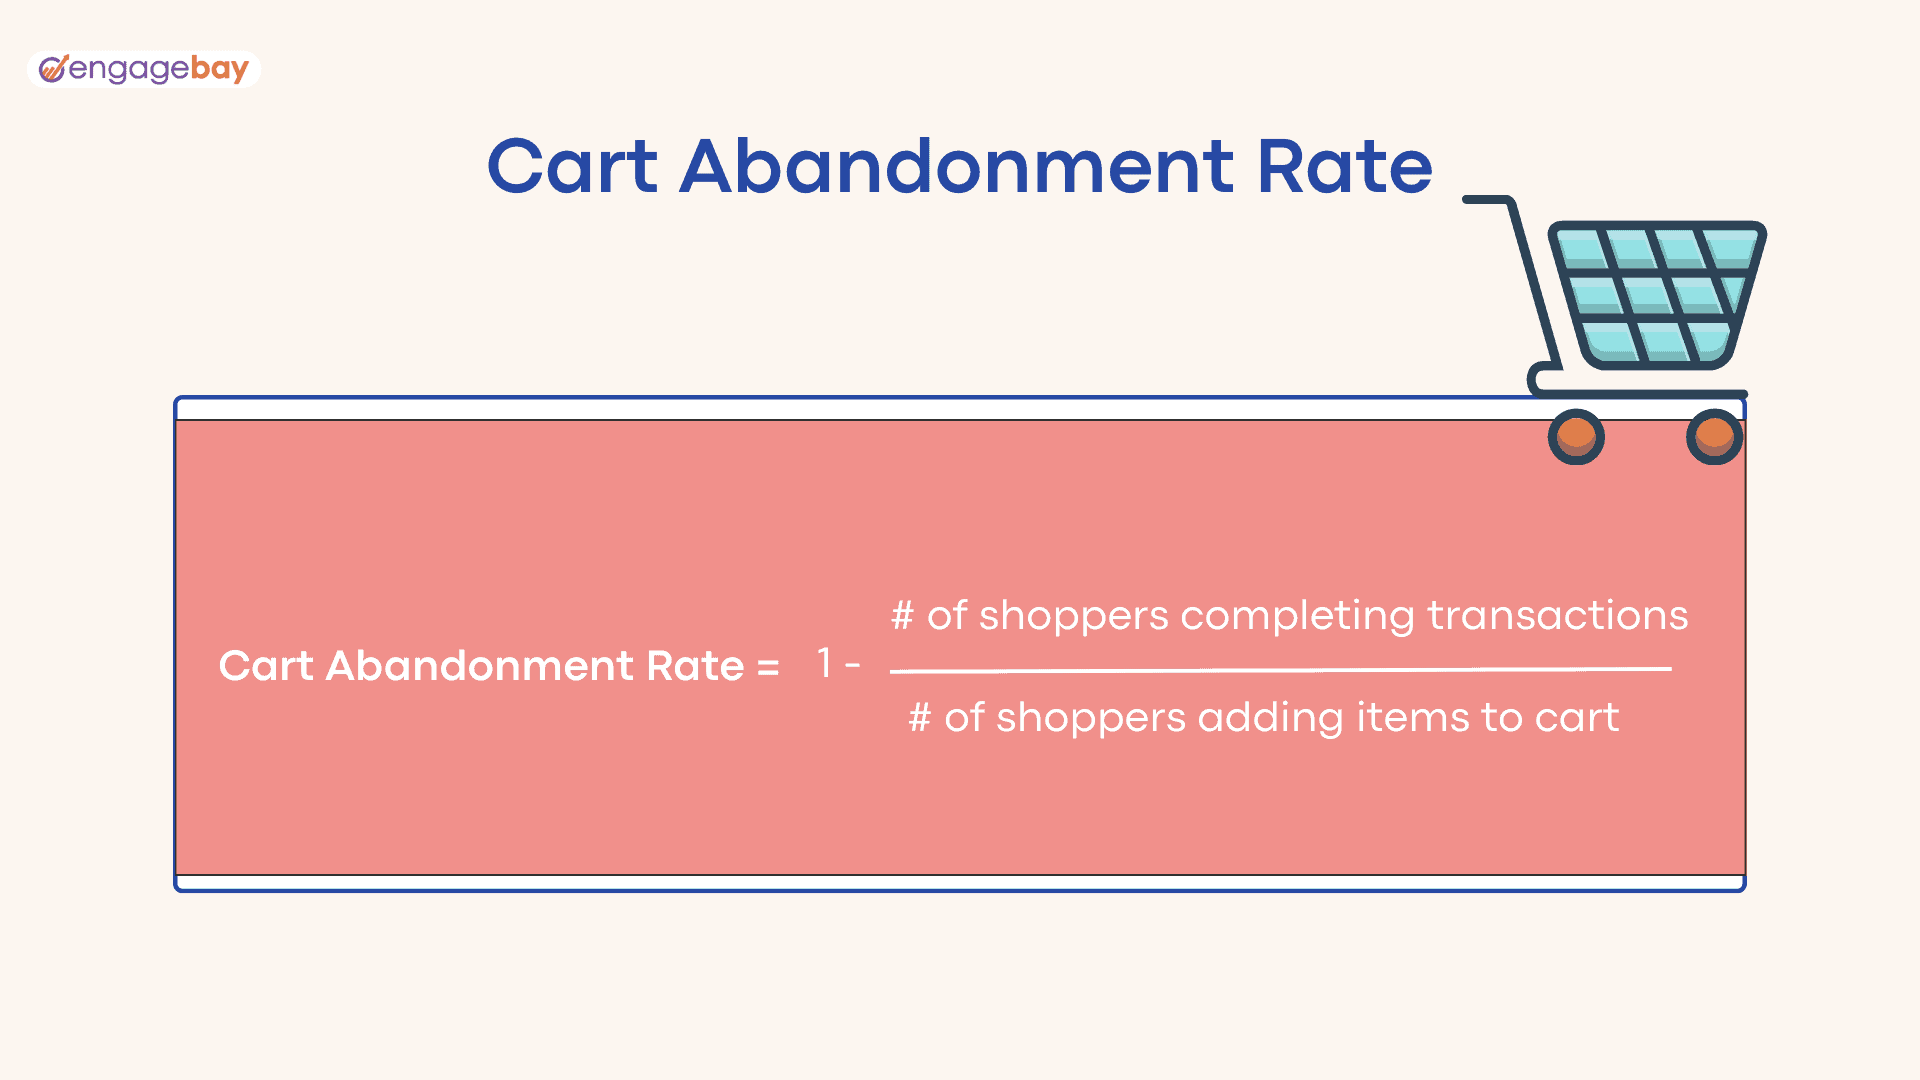
Cart Abandonment Rate tells how many people abandon their shopping carts after filling it out.
A Baymard Institute research shows that 69.82% of eCommerce shoppers abandon their shopping carts. This means that only three out of every ten customers complete their purchase.
By extension, $18 billion is lost annually due to cart abandonment, according to reports from Gartner.
If your cart abandonment rate is high, it’s vital to take action to reduce it.
The top three reasons for Cart abandonments during checkout are high extra costs, being required to create a new account, and too long checkout.
However, the above reasons may not apply to you. Carry out customer surveys to determine why your customers bail out on their purchases and fix the loopholes accordingly.
Taking action without first discovering why your eCommerce customers are abandoning their carts is counterproductive.
A shopping cart tracking system is one way to track cart abandonment. These systems allow you to track the number of orders that are placed, the number of orders that are completed, and the number of orders that are abandoned.
To manually calculate your eCommerce cart abandonment rate, use the formula in the image below.
eCommerce CRM: Top Platforms to Streamline Your Business
7. Gross Profit Margin
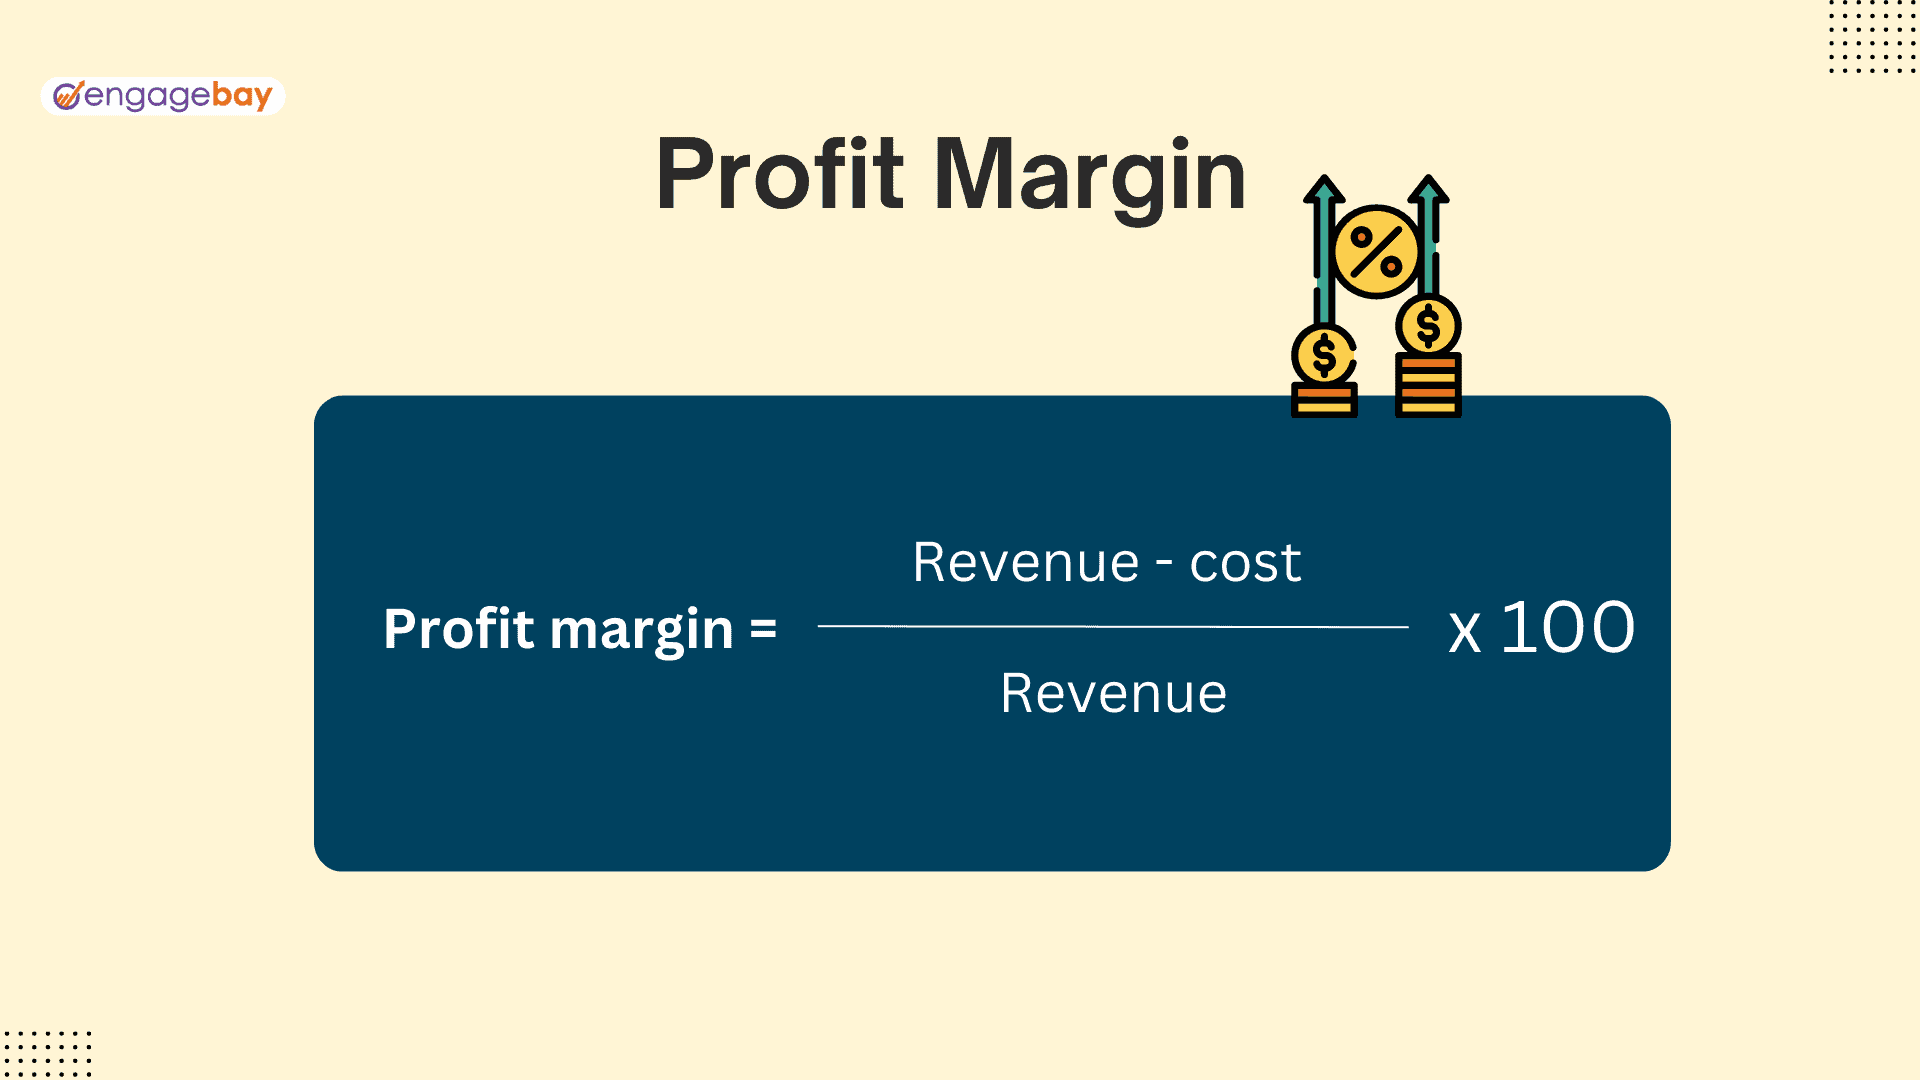
Gross profit margin shows how much of your eCommerce revenue you can keep after subtracting costs of goods sold (COGS). It gives you a snapshot of your eCommerce business profitability.
To calculate your gross profit margin, subtract the costs of goods sold from the total net sales in a given period.
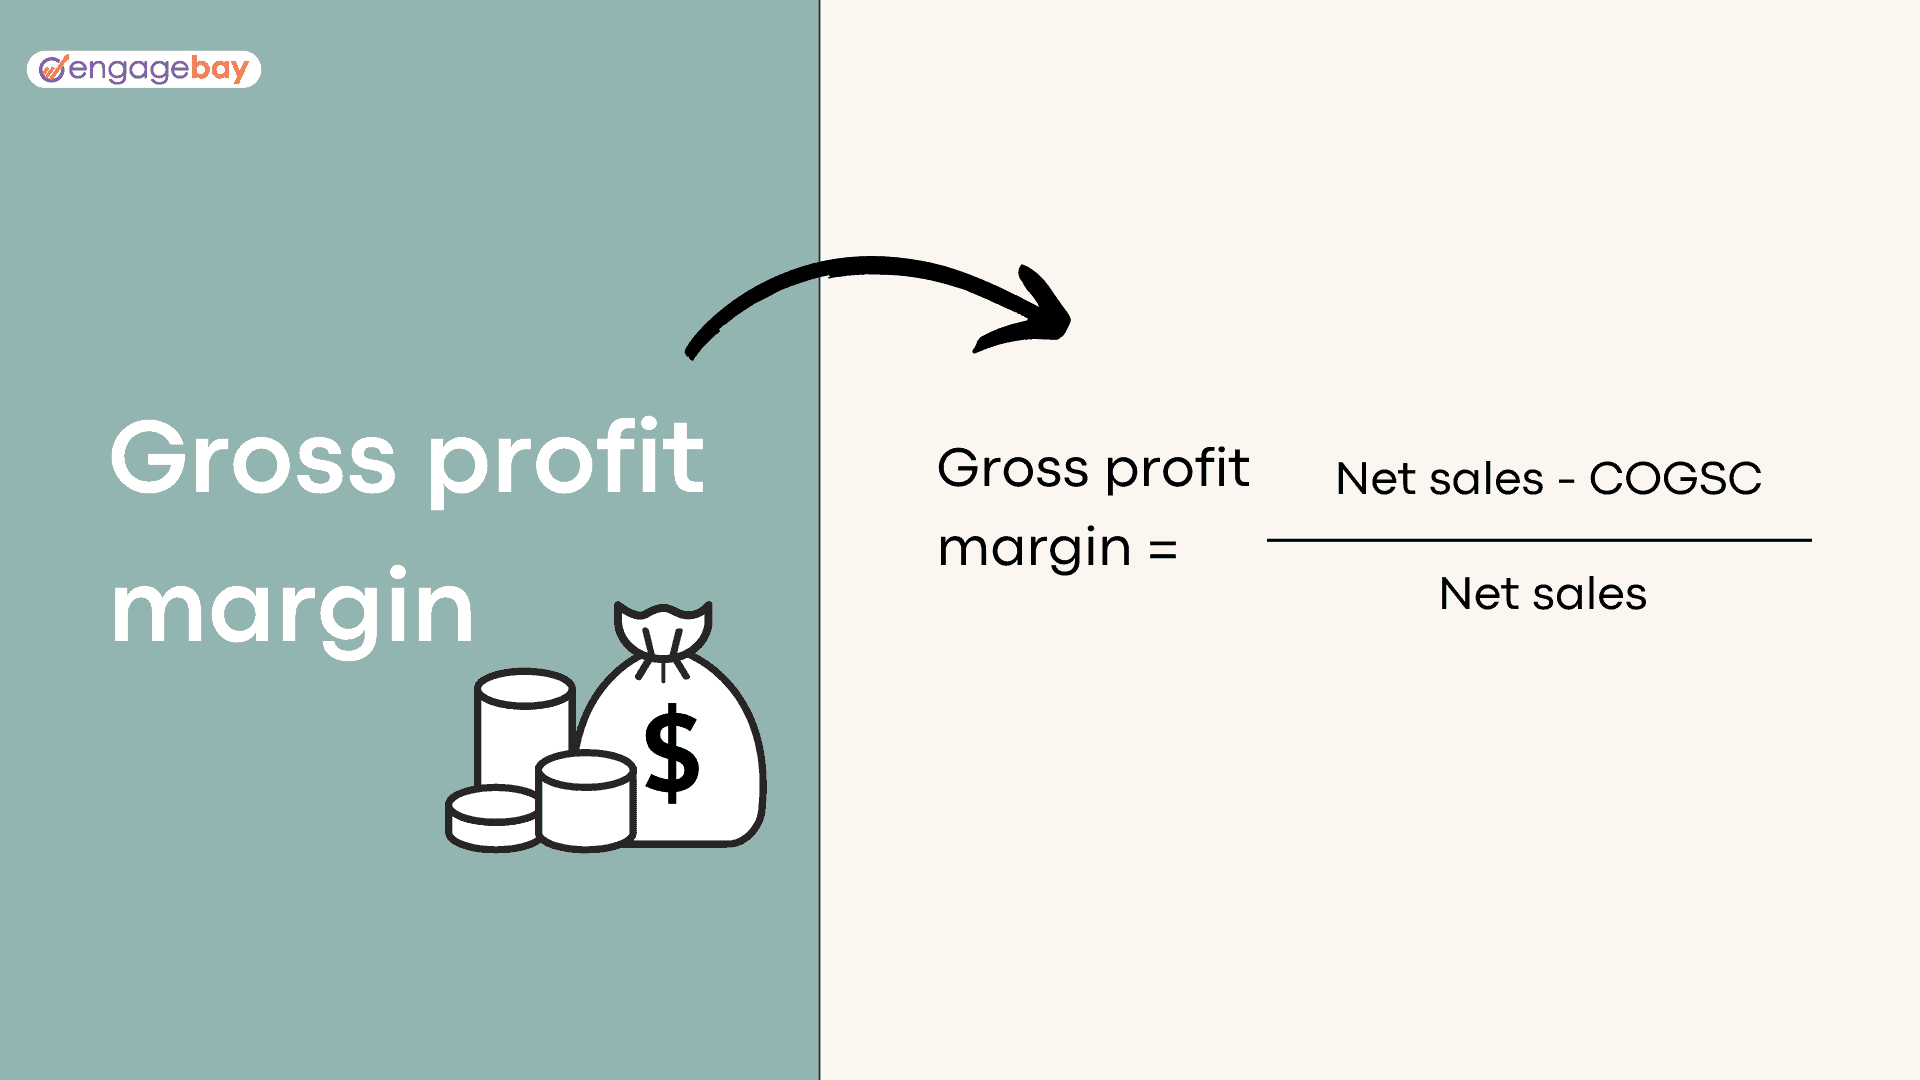 For example, if your eCommerce store generates $10,000 from sales within a set period, and the cost of goods sold is $6000, your Gross profit margin will be $4,000.
To get the percentage use this formula: Sales revenue – Cost of goods sold / sales revenue x 100. In this case, that would be 40%.
Read also: Master the Art of eCommerce Analytics with These 16 KPIs
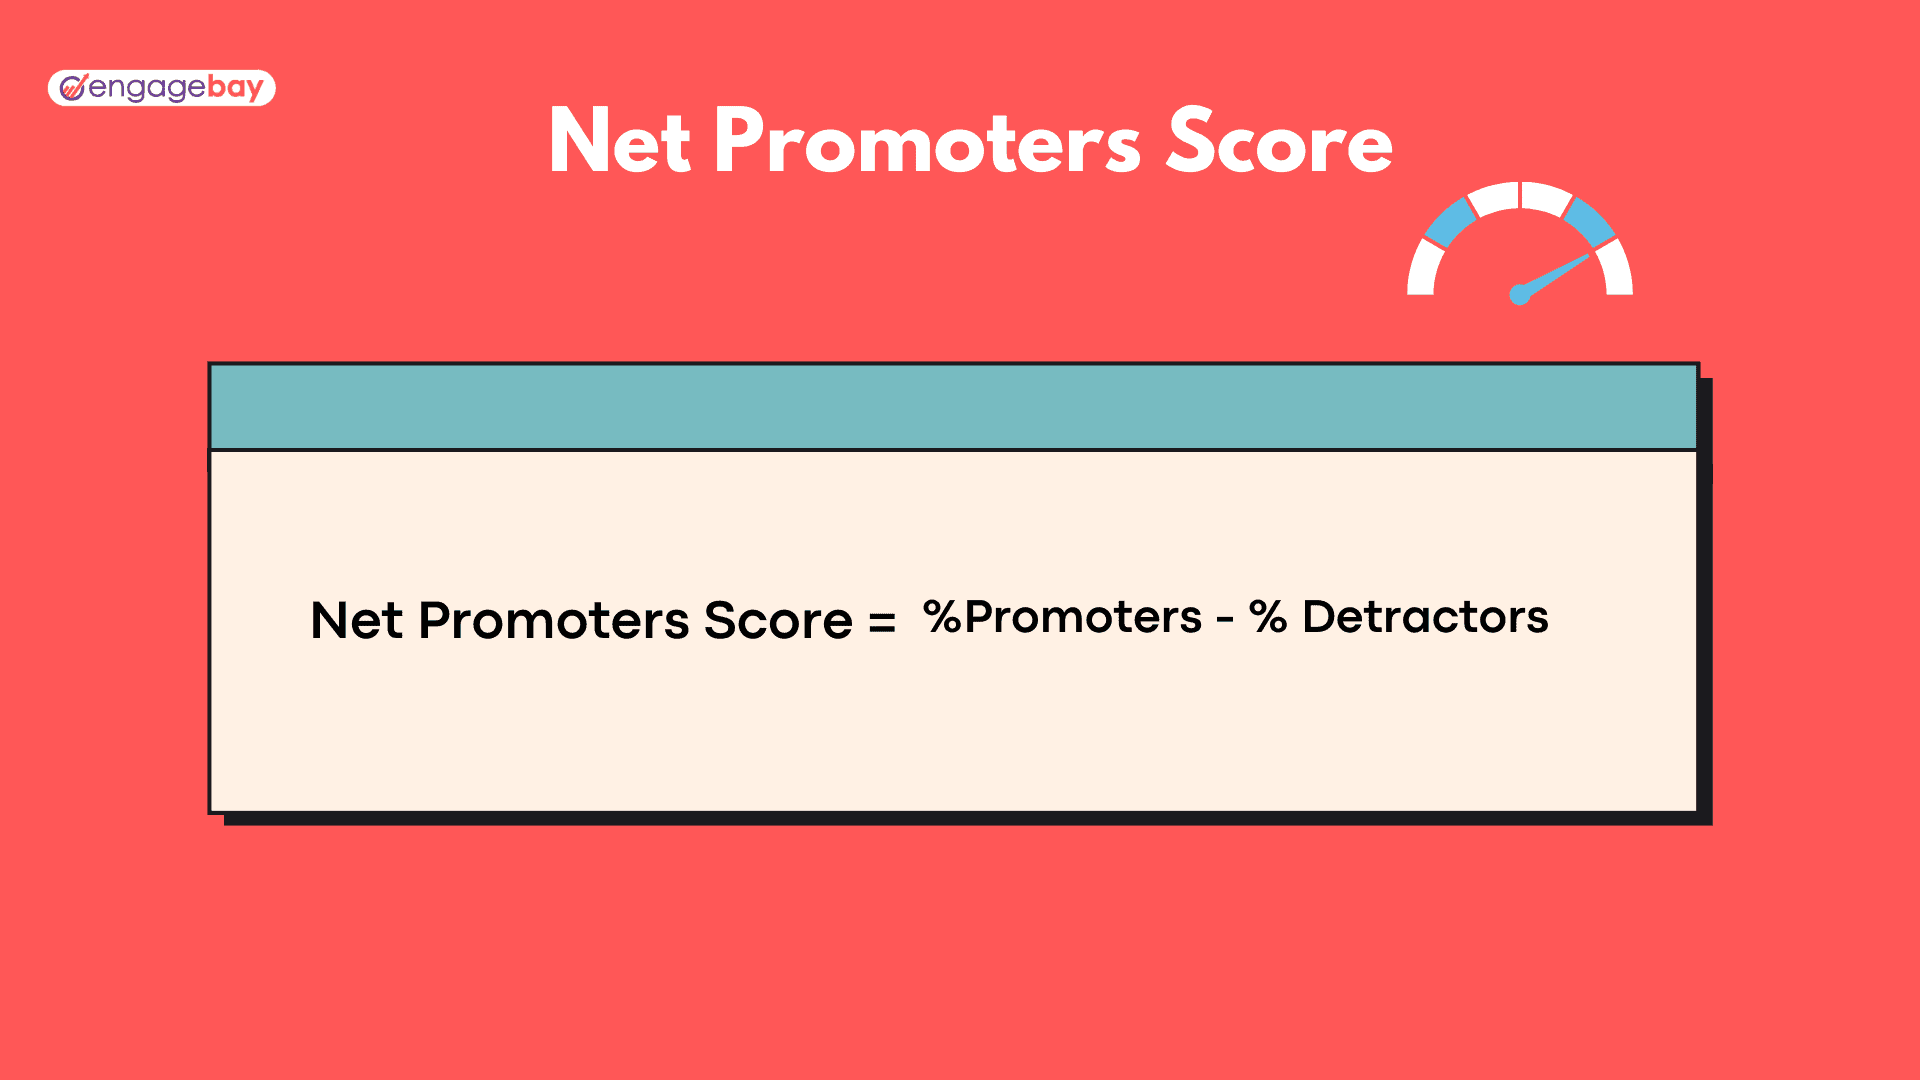
8. Net Promoters Score (NPS)
Net promoters score (NPS) is a customer satisfaction metric that measures how likely your eCommerce customers are to recommend your products to other customers or friends.
It is straightforward to carry out. All you need do is send out a survey to your customers asking, “On a scale of 1-10, how likely are you to recommend [insert product or company name] to your friends or family?”
Based on the scores, you can place your eCommerce customers into any of the following categories:
- Promoters (Scores between 9-10): They are your product evangelists and most likely recommend your products to other users. They form your most loyal customer base,
- Passives (Score between 7-8): This set of customers use your products and don’t necessarily have a problem with them. But like the name sounds, they are unenthusiastic about promoting your products.
- Detractors (Score between 0-6): These customers are unhappy with your products and are not likely at all to promote them.
You can calculate your NPS by subtracting the percentage of detractors from the percentage of promoters (the passives are not factored in).
The trick to increasing your NPS is to have more promoters than detractors.
So it would be best to work on converting your passives to promoters to get a high net promoter score. The higher the NPS score, the more satisfied customers are with the company.
Read also: The Beginner’s Guide To ECommerce Support Outsourcing
9. Average customer satisfaction rating
Customer satisfaction ratings give a quantitative insight into your customer experience using your products or with your eCommerce service in general.
It usually appears as a 1-to-5 star rating that helps prospects with purchase decisions and product research.
Having 4+ ratings helps increase your eCommerce sales and effectively drives ready-to-purchase customers to your eCommerce store. These ratings and reviews help drive more qualified leads to your product pages.
To measure customer satisfaction, you must understand what factors drive customer satisfaction, such as product quality, customer service, delivery times, and pricing.
You can get online reviews by taking online surveys or by in-person interviews. It also helps to be on review platforms like TrustPilot or Feefo, so your customers can find a place to review you.
Finally, it helps to use customer satisfaction ratings to identify areas for improvement and develop strategies for increasing customer satisfaction. EngageBay enjoys a 4.6 out of 5 overall rating on top review sites like Capterra, GetApp, and G2 from satisfied customers.
9 Great Email Marketing Software for eCommerce
10. Number of customer reviews
Online shoppers are likelier to purchase based on customer reviews than a sales pitch or product advertisement.
In fact, 81% of customers rely on reviews to evaluate businesses. Customer reviews show your customers’ first-hand experience using your eCommerce product. Good product reviews indicate that your product is valuable to customers and that they will most likely recommend it to others.
The best way to get more positive reviews is by ensuring your product is of excellent quality and solves users’ problems.
Notwithstanding your product’s greatness, you may occasionally get one or two unpleasant reviews. Don’t let that overwhelm you. Instead, use insights from the reviews to improve your product and services to drive sales and increase your eCommerce revenue.
Get Positive Online Reviews For Your Business, Consistently!
eCommerce Metrics for Experienced Business Owners
- Repeat Purchase Rate
- Customer Acquisition Cost (CAC)
- Return On Advertising Spend (ROAS)
- Gross Merchandise Volume
- Average Selling Price
- Best-selling Products
- Product Return Rate
- Product Profit Margin
- Mobile Bounce Rate
- Mobile Traffic
- Mobile Conversion Rate
1. Repeat Purchase Rate
The repeat purchase rate is designed to track the frequency of customers’ returns to purchase from your eCommerce store or website. It is an essential metric for online stores, as it can provide great insight into customer loyalty and the effectiveness of your eCommerce customer retention.
Measuring repeat purchase rates is relatively simple. First, calculate the number of repeat customers who purchase within a given timeframe. This can be done by looking at purchase history (you can easily track your eCommerce customer’s purchase history using EngageBay’s excellent customer database software) and tracking how many customers have purchased in the past month or quarter.
Once you have the number of repeat customers, you can calculate the repeat purchase rate by dividing that number by the total number of customers who have purchased during the same timeframe.
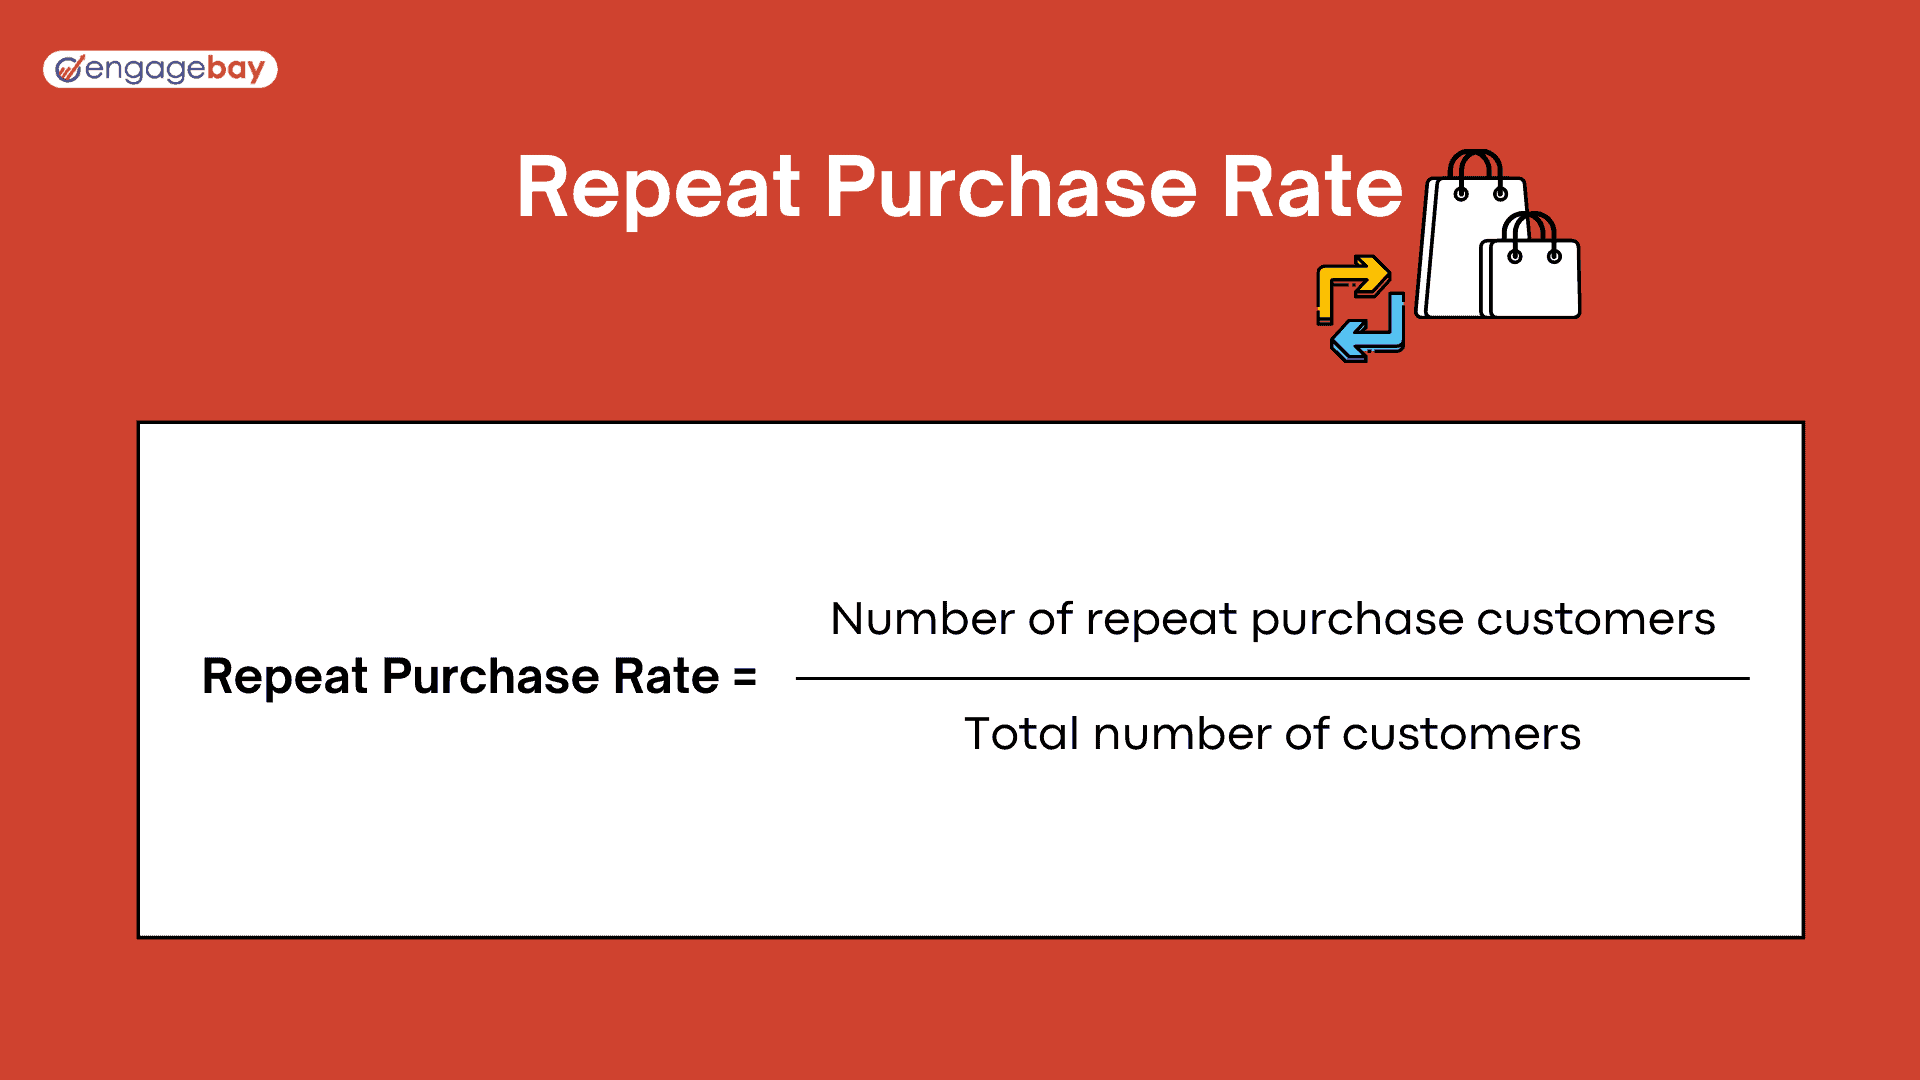
For example, if 100 customers made purchases in the last month and 20 of those customers were repeat customers, then the repeat purchase rate would be 20%. This number can then be compared to previous months or years to see how your store is doing regarding customer loyalty.
If the repeat purchase rate is increasing, customers are responding well to your campaigns and returning to make more purchases.
Conversely, if the repeat purchase rate decreases, your campaigns are not resonating with customers, and they may be shopping elsewhere.
Another way is to use a cookie-based system. This system sends a unique ID to your customer’s computer each time they make a purchase. You can then use this data to track how often customers return to your website and to see which of your products and services are most popular.
eCommerce Email Marketing Simplified: 15 Examples + Tips
2. Customer Acquisition Cost (CAC)
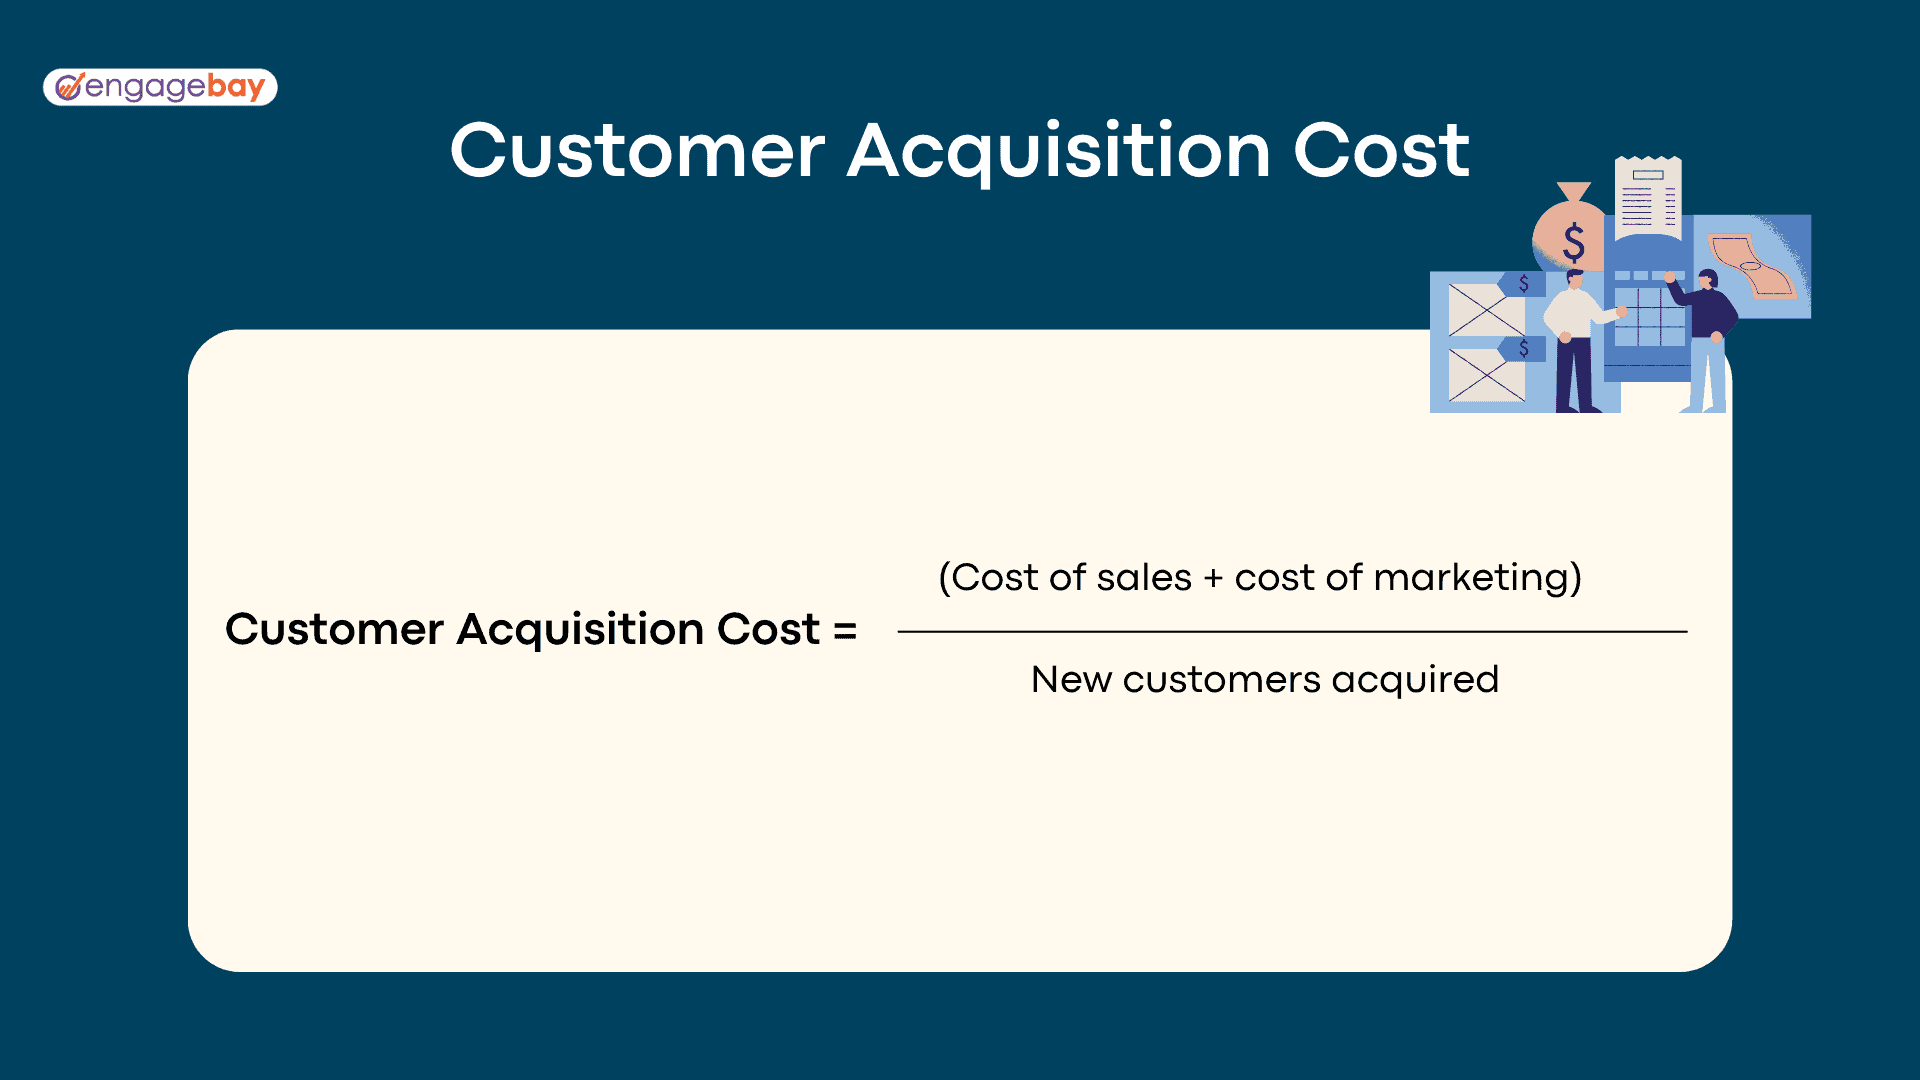
Customer Acquisition Cost (CAC) is an eCommerce marketing metric that measures the cost of acquiring new customers for your eCommerce business. It is a key indicator of the efficiency of your eCommerce company’s sales and marketing efforts.
CAC is a valuable metric to track as it helps you understand how much you spend to acquire each customer and how much you should invest in customer acquisition efforts.
You can easily calculate your Customer acquisition cost using the formula in the image below.
Another way to track your CAC is by analyzing the conversion rate of your website visitors. You can determine how much money you spend to acquire a new customer by analyzing the conversion rate of website visitors into customers.
Read also: The Best CMS for eCommerce
3. Return On Advertising Spend (ROAS)
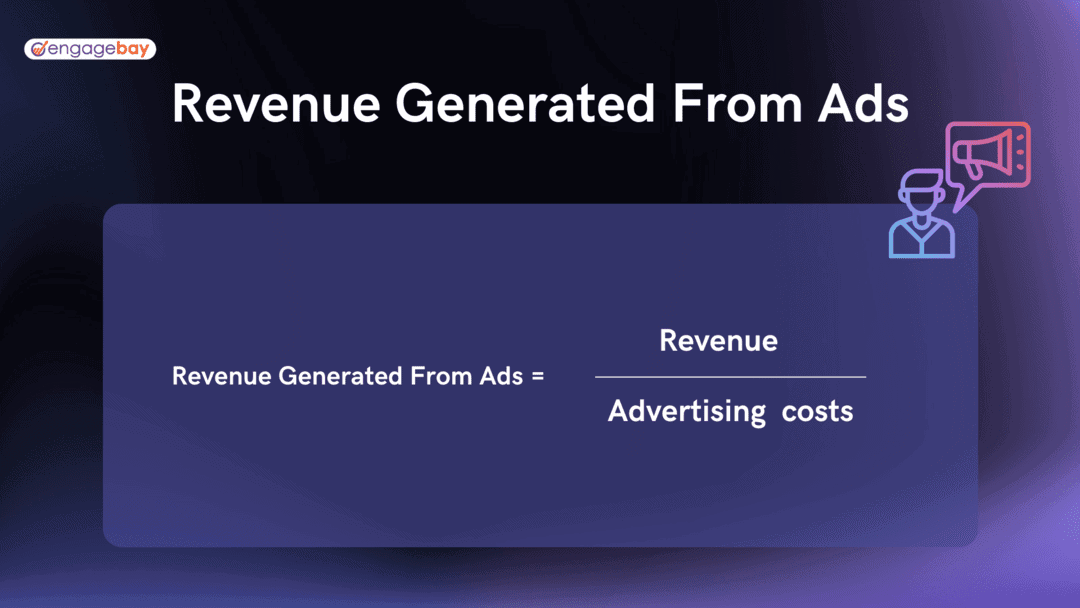
This metric tracks an advertisement’s return on investment (ROI) or how much money you earn in relation to the amount spent on an eCommerce advertisement. A high ROAS indicates that the advertisement is generating a positive return, while a low ROAS means the ad is not performing as well as expected.
This is calculated by dividing the amount of money generated from an advertisement by the amount spent on the ad.
For example, if you spend $2000 on an ad that generates $8000 in sales, your return on ad spend would be 4:1, the ROAS benchmark for eCommerce businesses.
To ensure your ROAS is as high as possible, there are three key factors to consider: the target audience, the type of advertisement, and the advertisement’s message.
The more targeted the advertisement is, the more likely it is to generate a higher ROAS.
Additionally, the advertisement’s messaging should be clear and concise, which will help encourage more sales. Finally, the type of advertisement should be chosen carefully, as different types of advertisement may have different effectiveness levels.
25 eCommerce Tools to Boost Sales in 2023
4. Gross Merchandize Volume
Gross Merchandise Volume (GMV) is an eCommerce marketing metric that measures all sales made through your online platform within a given period. GMV helps you track and analyze your sales performance. It also gives you data-driven insight into your business’s health because it tells you how profitable your eCommerce business is.
You can calculate GMV by multiplying the number of items sold by the total sales price of those items. This includes the cost of the product, any taxes, and shipping fees. It does not include discounts or returns.
By tracking your GMV, you can identify how much revenue you are generating and if your eCommerce sales are increasing or decreasing over time, so you can double down on your efforts to close more sales.
GMV is also a valuable metric for eCommerce marketers when conducting marketplace analysis. It helps compare the performance of your product against other competitors in the market.
Read also: 8 Game-Changing eCommerce Integrations For 4X Growth
5. Average selling price (ASP)
Average selling price (ASP) is one of the most crucial product performance metrics. ASP is the estimated amount an eCommerce customer pays to buy a specific product.
The ASP also provides an indication of the overall demand for a product and allows you to adjust its prices accordingly. It helps you make informed decisions about pricing your products, which is essential for remaining competitive in the market.
You can easily calculate your product’s average selling price using the formula in the image below.
6. Best-selling products
Best-selling product is a performance metric that looks at the number of units sold in a given period. This metric helps you determine which products are the most popular and make data-driven decisions on which products to invest in.
Additionally, It helps you understand what types of products your eCommerce customers are most interested in.
👉Supercharge your ecommerce business with the ultimate marketing tool recommendations – dive into our in-depth guide today! 🚀
Read also: How to Conduct eCommerce Market Research in 2024
7. Product return rate
There’s no denying that product returns are a common occurrence in eCommerce shopping. The eCommerce industry return rate could be as high as 20% – 30%.
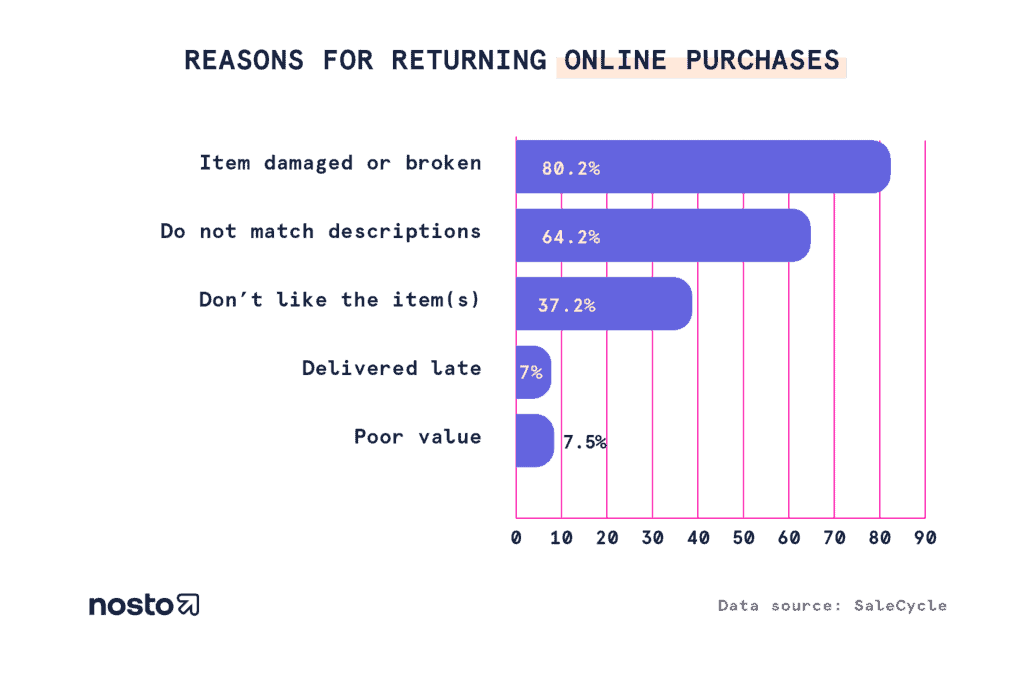
There are many reasons why customers might return a product. The image below gives a statistical report on generic reasons for product return.
To reduce your eCommerce product return, provide a quality guarantee, ensure that your products are authentic, and match the product ordered in size, color, etc.
Additionally, provide customer support and ensure your products are easy to use and understand. If they’re not, customers will likely return them.
To calculate your eCommerce product return rate, divide the no. of products returned by the total number of products sold.
 So, if your total eCommerce sales were 10,000 units within a quarter and 2000 units were returned, your product return rate would be 2000 / 10,000 x 100 = 20%.
Read also: eCommerce Customer Expectations: The Science of Delight
8. Product profit margin
Product profit margin is a key performance indicator (KPI) that determines the profitability of your eCommerce products. It refers to the percentage of revenue left after expenses are subtracted.
A high-profit margin indicates that your products are profitable and their income is high enough to cover their business expenses.
Conversely, a low product margin suggests that your products are not profitable, and its revenue needs to be increased to cover business expenses.
Here’s a formula to easily calculate your product profit margin.
Several factors affect product profit margins, such as pricing and sales volume. Keeping track of these factors is vital to consistently producing profitable products that meet customer needs.
That way, you can ensure that your company is achieving its profit goals and that your eCommerce customers are happy too!
eCommerce Email Marketing Simplified: 15 Examples + Tips
9. Mobile bounce rate
Mobile metrics such as mobile bounce rate are becoming increasingly important in the eCommerce marketing sphere.
Consumers increasingly rely on mobile devices to access and engage with online content. As such, you need to know the metrics associated with mobile use, which will help you gauge your marketing efforts.
One of the most critical mobile metrics is the mobile bounce rate. Like website bounce rate, this metric measures the number of people visiting your website from your mobile device and immediately leaving without engaging with any content.
This is important for eCommerce marketers to track because it indicates how effective and user-friendly your site is optimized for mobile users.
The Beginner’s Guide to eCommerce Marketing Automation
10. Mobile traffic
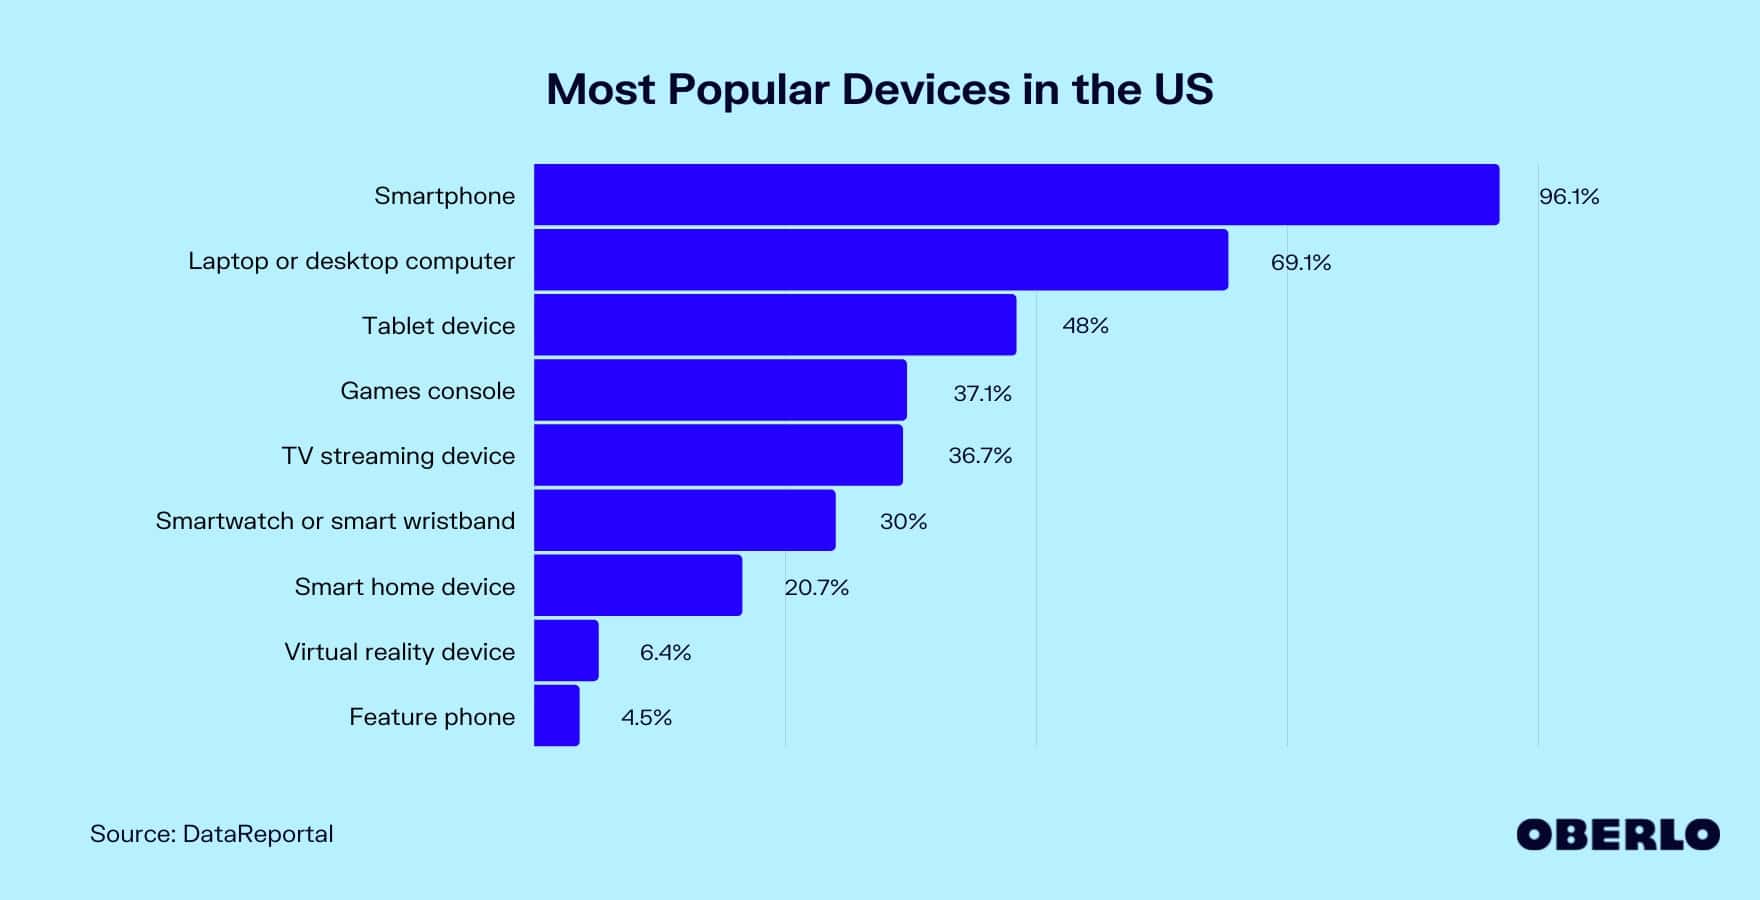
When was the last time you browsed a site on your desktop for an online purchase? You may even be reading this right now on your mobile device. And that’s the reason you should be tracking your mobile traffic.
Tracking mobile traffic metrics for eCommerce marketing in this digital age has become increasingly important.
Smartphones are now the primary source of online activity for 92.1% of consumers, with 75% of eCommerce purchases coming from mobile devices. This makes the analysis of mobile traffic a key metric for any eCommerce business.
This metric helps eCommerce marketers understand how well their website is optimized for mobile devices. If mobile visitors are low, the website must be optimized for mobile devices to maximize engagement and conversions.
8 Free eCommerce Website Builders For Every New E-Preneur
11. Mobile conversion rate
This is the number of purchases made on mobile devices. It can be used to identify which devices drive the most sales. This data can be used to understand when and where customers buy from. It also helps optimize the mobile experience to push leads further down the sales pipeline and increase mobile conversions.
To optimize mobile conversion rate, it is crucial to understand what your customers are looking for. Understanding your customer’s needs helps create content and eCommerce product offerings tailored to them.
You can calculate your eCommerce mobile conversion rate using the formula in the image below.
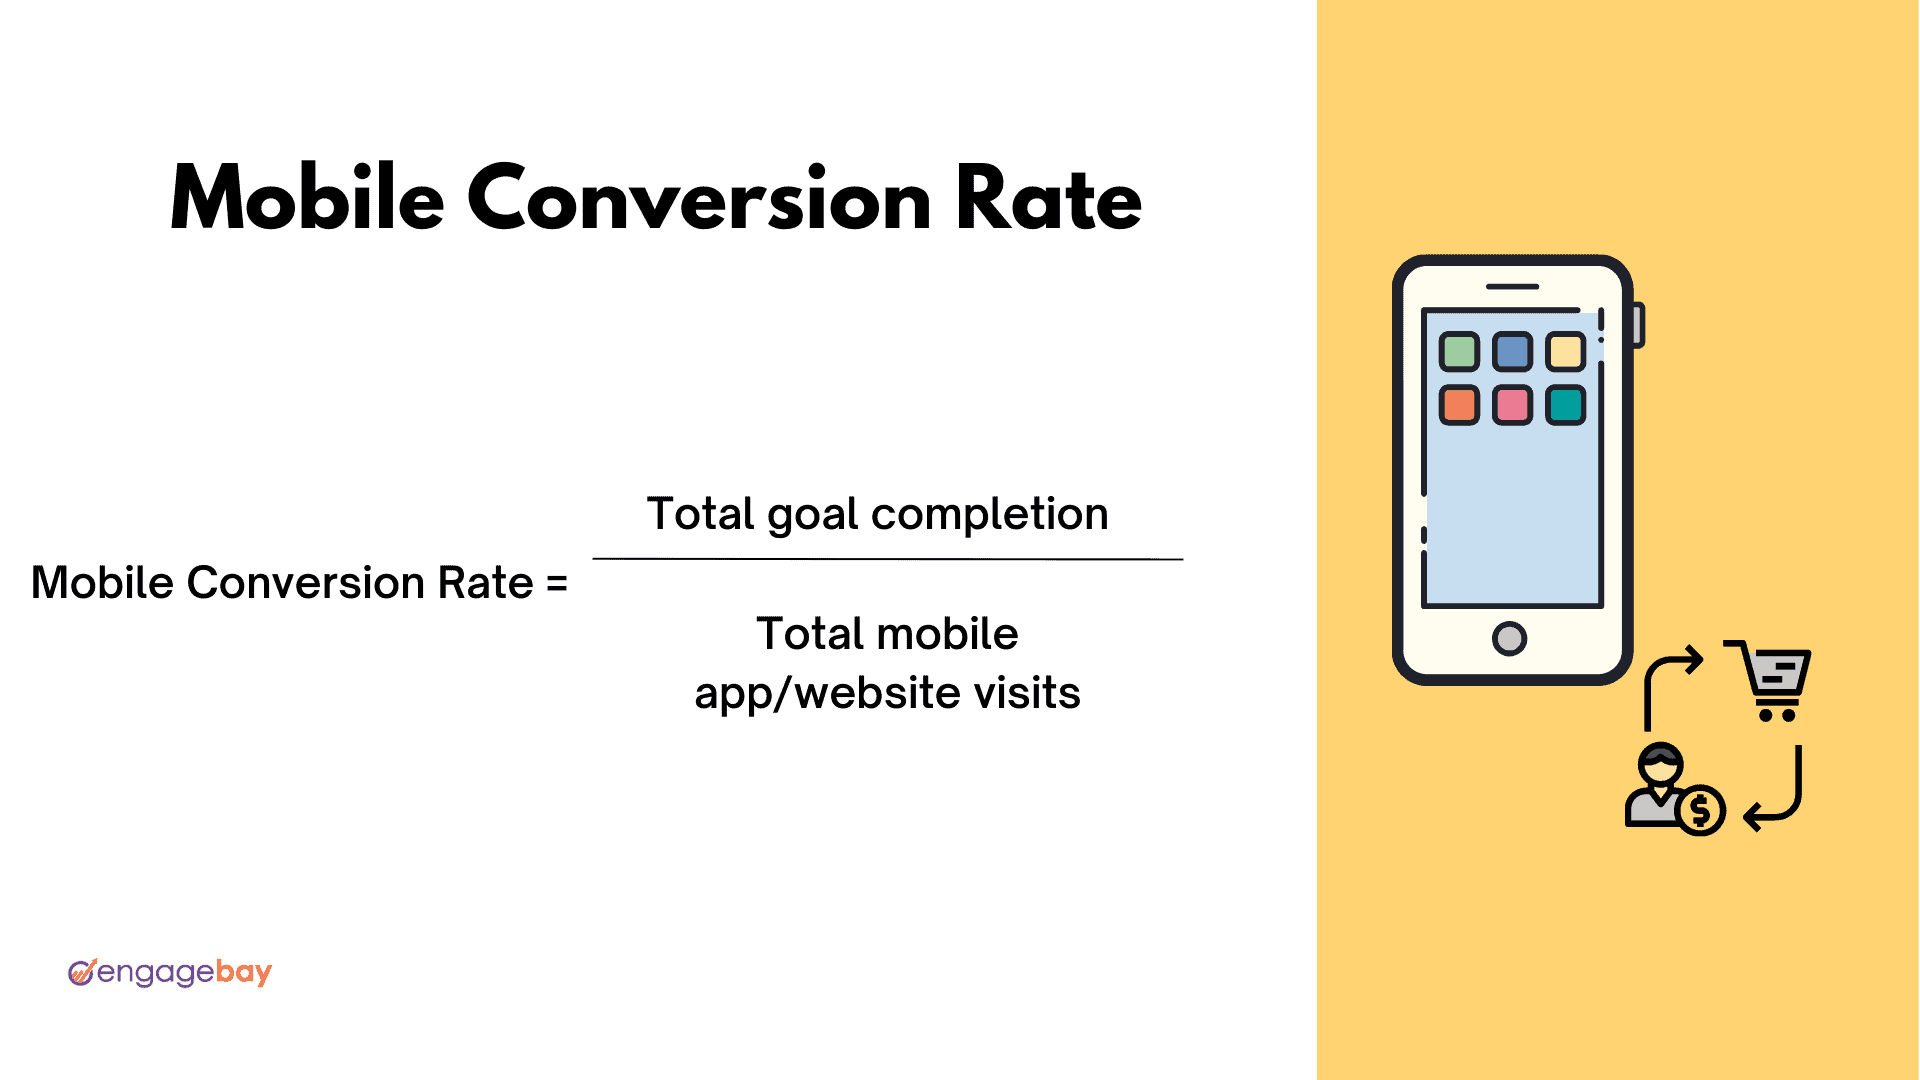
Additionally, optimizing your website or app for mobile devices is vital. This means ensuring your website or app is user-friendly and easy to navigate on mobile devices.
19 eCommerce Best Practices to Win Customer Confidence
Wrap Up
Tracking all the eCommerce marketing metrics listed in this blog post immediately will overwhelm you.
To prevent that, if you’re new to the eCommerce business landscape, we recommend you begin by tracking the metrics listed above for beginners, such as conversion rate, Average Order Value, and Customer Lifetime Value.
Conversely, if you are an experienced eCommerce business owner, in addition to the metrics listed in the beginners’ category, track the expert metrics such as Return On Advertising Spend (ROAS) and Gross Merchandize Volume to get advanced insight into how your eCommerce store is performing.
Finally, track your sales easily, manage your customer database, and monitor your performance over time on EngageBay’s all-in-one CRM.
Additionally, it helps you automate your sales, marketing, and customer support for maximum efficiency, all on one platform. Plus, it integrates with Shopify too!
👉Empower your ecommerce business with the best marketing ideas – learn more in our expert guide! 💪
eCommerce Frequently Asked Questions
What is the difference between marketing metrics and KPIs?
The key difference between marketing metrics and KPIs is the purpose they serve. Metrics provide a measure of performance and are used to evaluate the success of marketing campaigns.
On the other hand, KPIs are used to set goals and track progress toward achieving those goals.
What are the most important marketing metrics?
There are several marketing metrics, and the most important ones will depend on the goals of your eCommerce business, the size, the industry, and your experience level.
For instance, if the goal is to generate leads or measure the quality of your eCommerce leads, then website traffic and conversion rate would be two critical metrics to track.
If you want to increase sales, customer lifetime value (LTV) and return on Return On Advertising Spend (ROAS) would be key metrics to monitor. In this blog post, to keep it simple, we divided the top e-commerce metrics you must know based on your experience level.
How often should I measure marketing metrics?
The frequency with which you measure marketing metrics will depend on your eCommerce goals and the metrics you are tracking. If you’re tracking your eCommerce site traffic, then monitoring the data weekly or monthly is a good idea. On the other hand, if you’re trying to track Customer Lifetime Value (CLV), it’s best to follow it annually.